For small charities, one funder can be half of what they raise
Utah Nonprofits, by the Numbers #6
Last week’s post showed that 20 grantmakers give half of the grant money Utah grantmakers give in Utah. This week looks at the other side of those grants: how much a charity depends on any one of them.
I matched the grants Utah foundations and grantmaking charities reported for 2023 to the recipients’ own 990 filings, then compared each charity’s largest Utah funder with everything it reported raising that year. In the filings I could see, most charities spread their risk, but among the smallest, 1 in 5 get half or more of their contributions from a single Utah grantmaker.
The number
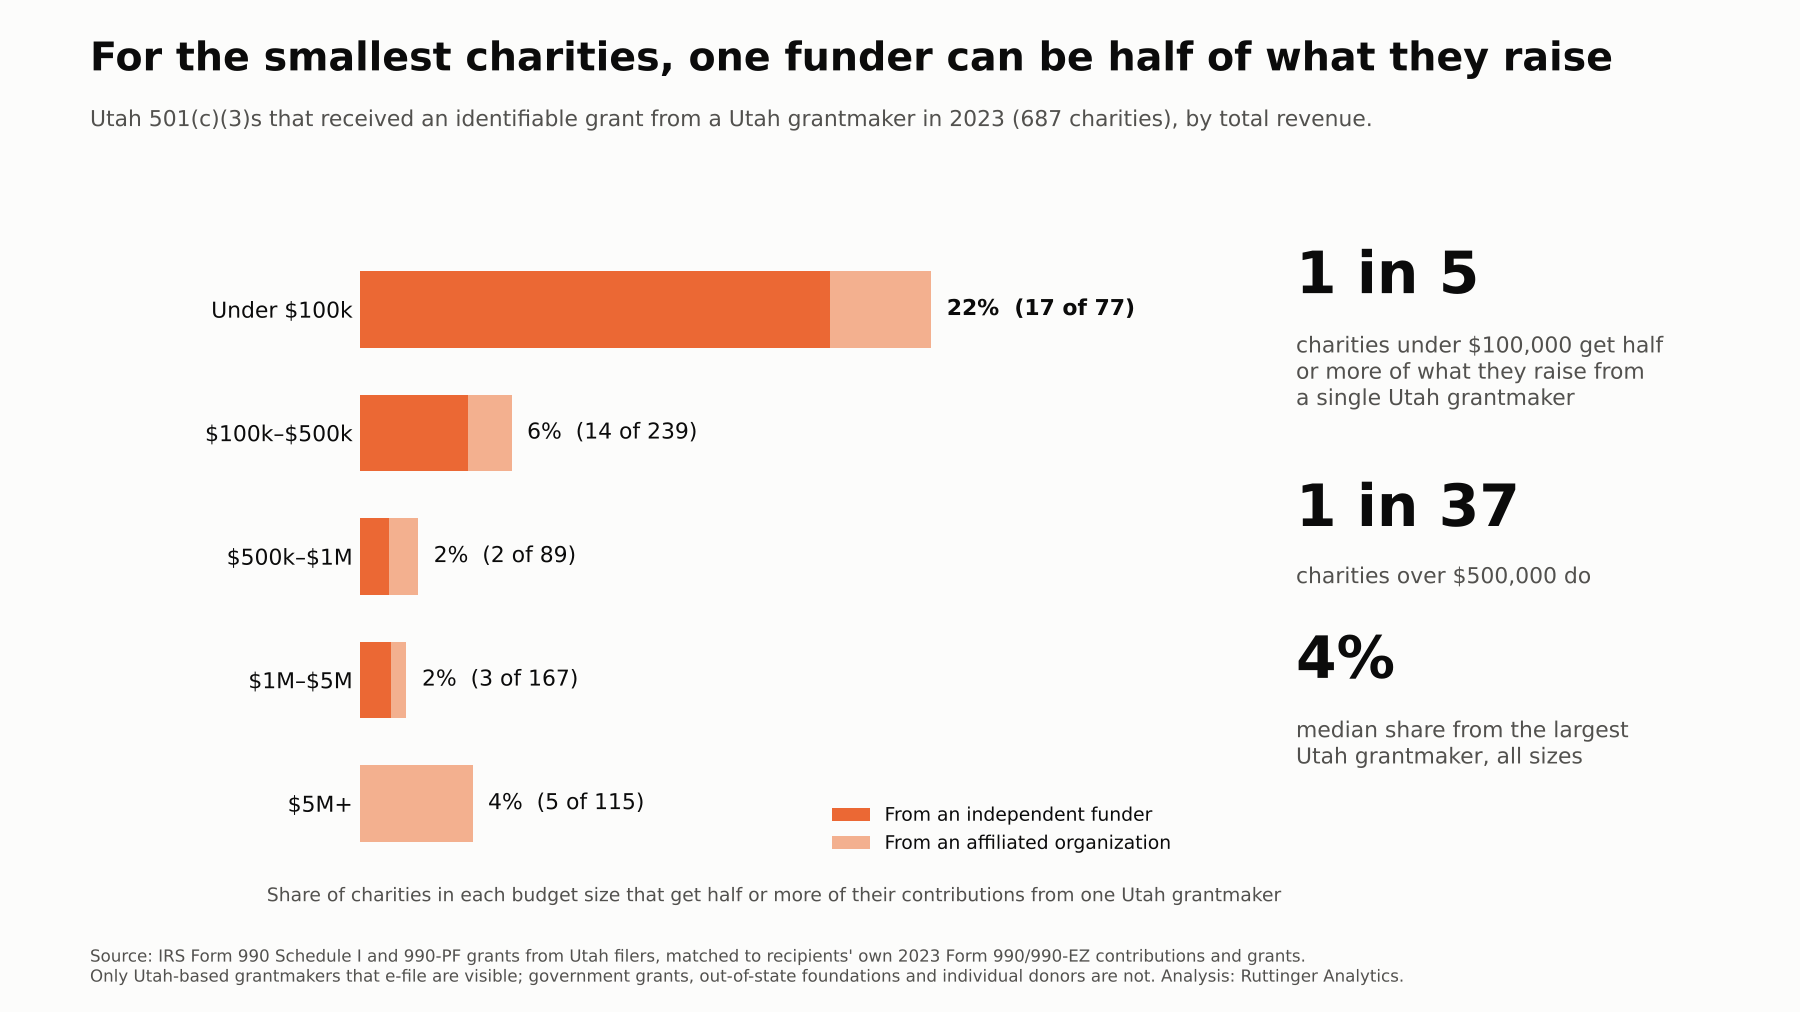
| Utah 501(c)(3)s with an identifiable 2023 grant from a Utah grantmaker | Charities | Half or more from one funder | A quarter or more from one funder |
|---|---|---|---|
| Under $100,000 | 77 | 17 (22%) | 35 (45%) |
| $100,000–$500,000 | 239 | 14 (6%) | 35 (15%) |
| $500,000–$1 million | 89 | 2 (2%) | 7 (8%) |
| $1–5 million | 167 | 3 (2%) | 11 (7%) |
| $5 million and up | 115 | 5 (4%) | 10 (9%) |
| All | 687 | 41 (6%) | 98 (14%) |
“Contributions” here means everything on the charity’s contributions-and-grants line: individual gifts, foundation grants, government grants and fundraising events.
Fourteen of the 41 get their largest grant from an affiliated organization, such as a parent association funding its own foundation or a health system moving money between its hospitals. That’s dependence by design. All five of the large charities ($5 million and up) fall into that group. The other 27 depend on an independent funder, and 24 of those have budgets under $500,000.
Most charities aren’t in this position
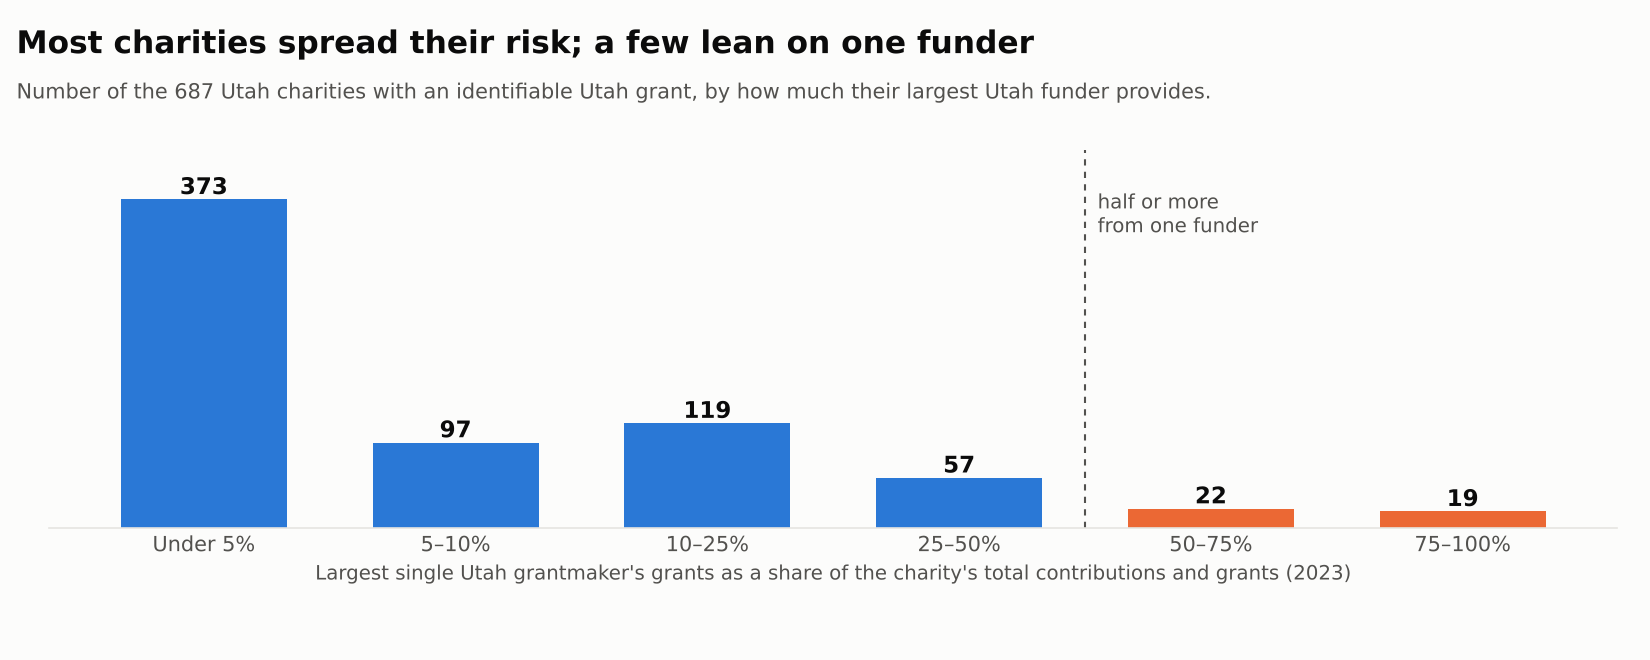
For the typical charity in this group, its largest Utah funder provides 4% of what it raises. Taken together, grants from Utah grantmakers account for about 7% of these charities’ contributions. The rest comes from individuals, government, events and funders based elsewhere.
So the risk isn’t spread evenly. It sits with small organizations, where one foundation’s $25,000 grant can be most of the year.
What it means
For small organizations, a single funder providing half your revenue is a planning problem, not a fundraising detail. The grant may renew for years. But if it doesn’t, the decision about what to cut gets made in a hurry, by whoever is in the room.
For funders, your grant may be the largest line in a small grantee’s budget. Multi-year commitments, early notice of changes, and a conversation about what would happen without you are cheap and make a big difference.
For boards, “Who are our three largest funders, and what share of revenue is each?” is a question every board should be able to answer from memory.
What this says about analytics maturity
This is the decision stage. Dependency isn’t something to predict; it’s something to plan for. The basic tool is a scenario: if our largest grant isn’t renewed next year, what do we cut, what do we keep, and how long can we keep going?
That doesn’t need a model. It needs three things most small organizations can pull together in an afternoon: revenue by source for the last three years, the renewal date for each major grant, and a monthly expense number. A practical step: put those on one page and bring them to your next board meeting. The conversation that follows is the start of data-informed planning.
What the data can’t see
- Only Utah-based grantmakers that e-file are visible. A charity whose largest funder is a national foundation, a government agency or an individual donor won’t show up as dependent here. Read these figures as lower bounds.
- Matching is imperfect. Most private foundation grant lines list the recipient by name only. I matched 42% of grant lines (46% of the dollars) to a specific Utah charity, by tax ID where one was given and otherwise by exact name. Grants I couldn’t match can only add to the dependence counts, not reduce them.
- Fiscal years don’t always line up. A grant in the funder’s 2023 year may land in the recipient’s 2022 or 2024 year. I set aside 9 charities whose largest grant exceeded 120% of what they reported raising, which signals that mismatch.
- One year is a snapshot. A charity that depends on one funder this year may not next year, and a one-time capital grant can look like dependence.
- No individual organizations are named, here or in the charts.
Method
Data and matching
- Grants: 990-PF grants paid and Form 990 Schedule I grants from e-filed returns of Utah grantmakers, tax year 2023 (one return per grantmaker, the latest filed). A foreign filer reporting a placeholder recipient was removed. Grants to individuals excluded.
- Recipients: Utah 501(c)(3) organizations that filed a 2023 Form 990 or 990-EZ reporting contributions and grants above zero (2,191 organizations). 696 could be matched to at least one Utah grant: by recipient EIN where the grant line gave a valid one, otherwise by exact normalized name against the IRS master file (names shared by two organizations were not matched).
- Dependence: the largest single Utah grantmaker’s 2023 grants to the charity, divided by the charity’s own 2023 contributions and grants (Form 990 Part VIII line 1h; 990-EZ line 1).
- Affiliated: the grantmaker sends 80% or more of its Utah grants to one recipient, or the grantmaker and recipient share a distinctive word in their names (for example an association and its foundation), or both belong to the same health system.
- Revenue bands use total revenue on the recipient’s 2023 return.
The calculation (Python)
by_pair = grants.groupby(["recipient_ein", "funder_ein"]).amount.sum().reset_index()
top = by_pair.sort_values("amount").groupby("recipient_ein").tail(1)          # largest funder per charity
df = recipients.merge(top, left_on="ein", right_on="recipient_ein")
df["top_share"] = df.amount / df.contributions_grants
df = df[df.top_share <= 1.2]                                                   # drop fiscal-year mismatches
(df.top_share >= 0.5).groupby(df.revenue_band).mean()                          # 22% under $100k
Where does your organization stand?
Knowing your revenue mix is the first step in planning for it. Take the short analytics maturity assessment to see where your organization’s data practices are strong and where the next step is.
Next post, on GivingTuesday (December 1): restricted money. How little of the grant money in Utah’s filings is labeled general operating support.