Cases
80 % BSN by 2020
In 2008, The Robert Wood Johnson Foundation (RWJF) and the Institute of Medicine (IOM) launched a two-year initiative to assess and transform the nursing profession. In 2010, the IOM released The Future of Nursing: Leading Change, Advancing Health with the purpose of producing a report that would make recommendations for an action-oriented blueprint for the future of nursing.
One of the messages from the report was the all too prescient call to improve data.
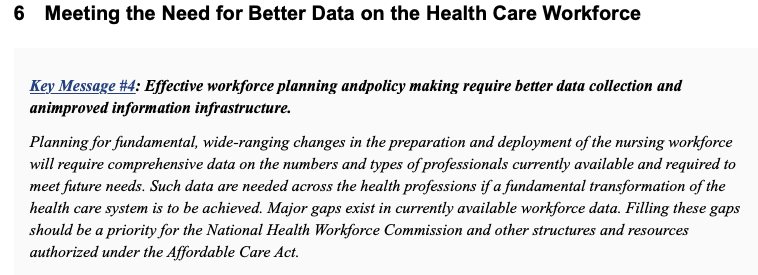
Specifically, they wanted to measure percent of Bachelors prepared nurses across the country.

In 2015, I conducted the state’s first RN workforce supply survey. Analysis of this data found that 42% of the RN workforce was prepared at a bachelors level (pg 13).
In 2017, Joanne Spetz, PhD of the Philip R. Lee Institute for Health Policy Studies, University of California, San Francisco analyzed how far that goal was from being actualized nationally by creating a projection model of bachelors prepared nurses in the national nursing workforce using the American Community Survey(ACS).
Inspired by Dr. Spetz’ work, my team and I created an interactive projection of the Utah nursing workforce using Utah sources for the projection rather than the ACS. The projection model allows a user to modify the inputs to the model to examine how altering these input variables affects the projected bachelors prepared workforce percentage. The baseline projection showed Utah going from 55% bachelors prepared in 2017 to 61% by 2020. Even projecting out as far as 2035, Utah only stood to be at a 72% bachelors prepared workforce, assuming that none of the factors in the projection model changed. When my team and I surveyed the Utah RN workforce in 2020, we found that the bachelors prepared workforce had risen to 56.2% (pg 29).
The value of this model is two fold:
1. Demonstration of underlying factors involved in measuring the state’s system for producing nurses. The model uses data from several sources to produce the projection.
UMEC RN supply surveys
- Retention, Attrition and Retirement rates
UMEC’s RN Education survey of all nursing schools in Utah.
- Number of graduates per year by age and program type.
Nurse Licensing data from the State of Utah
- Current workforce by age.
Utah Population Projections from census and state demographers
National Council of State Boards of Nursing national estimates of RNs
2. Ability to produce counterfactuals to examine the best strategy of attaining a defined goal for the system.
What is the result in the model of adjusting for the impacts on enrollment from the pandemic ?
What will happen as the model is adjusted for anticipated future retirements?
Do targeted increases in the number of available seats in programs result in more retained graduates of specific types?
Ultimately further work needs to be done to take this from a single use specific model to an operationalized and automated application for projecting the future state of any point in the system. My team and I intend to pursue this work in 2023.
Nursing Employment Demand
Out of the The Future of Nursing 2010- 2020 report the The Robert Wood Johnson Foundation and AARP created the Campaign for Action. Through this campaign an action coalition was created in each state to implement the goals of the Future of Nursing Report.
In 2018, the Utah nurse action coalition worked with Utah Legislators to produce S.B. 147. This nursing initiative required the UMEC to produce a nursing demand study for the state and for funding of nurse education programs to be tied to identified future nursing employment needs.
I developed the methodology and data linkages to produce a nursing employment demand study from existing state data sources that can be updated at future periods automatically by refreshing the source data.
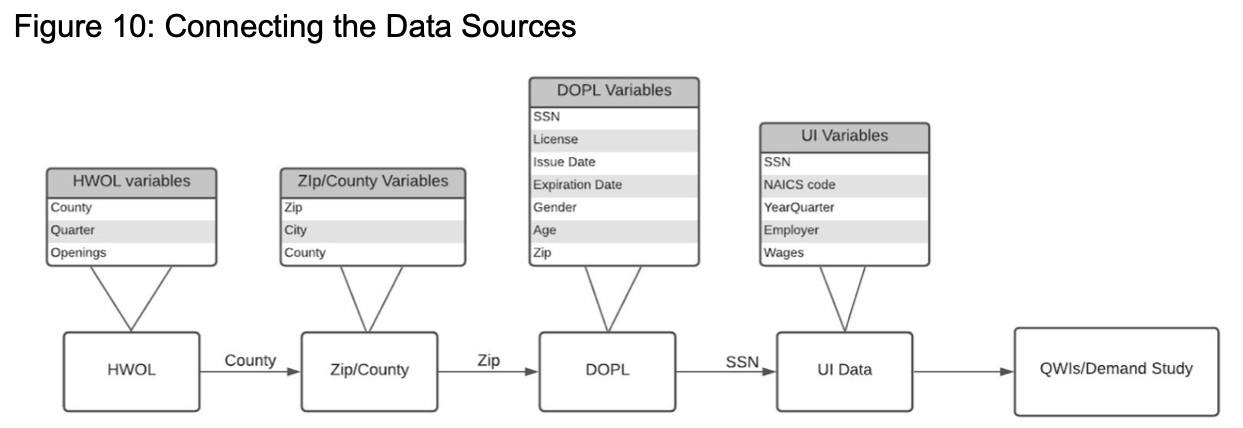
This design allows for a persistent dashboard application to be created to update the employer demand analysis when needed.
My team and I produced our baseline report in 2020. It captured the first quarter of the pandemic. We are currently working on a release of an update to the analysis that will look back on what happened over the pandemic time period (Q2 2020 through Q3 2021).
I developed the methodology for this employer demand study from sources identified through my own literature review. The two primary guiding sources are quite disparate in nature but compliment and inform each other very well.
The first is the National Forum of State Nursing Workforce Centers minimum data set recommendations for demand. These are a set of recommended questions to be asked of nursing employers in each state to measure nursing employer demand. Typically these questions are deployed through a survey methodology to identified nursing employers in a state. I produced demand studies for the state of Utah using a survey methodology in 2015 and 2018. The shortcomings of this previous methodology, namely that it is very time intensive to gather data in this manner, made me want to look for a better way to produce a demand study into the future.
The second source for the methodology I developed are the Quarterly Workforce Indicators (QWI) published by the U.S. Census. QWIs provide local labor market statistics by industry, worker demographics, employer, age and size. The source data are unique job-level data that link workers to their employers.
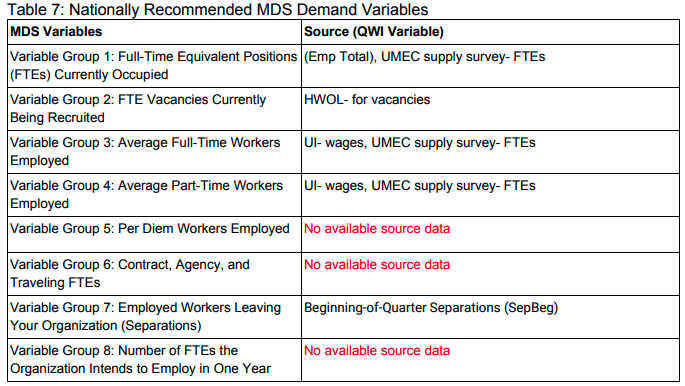
The nursing employment demand report goes into detail on the strengths and weaknesses of this methodology. My personal thoughts as a data analyst and designer are that the methodology utilizes defined questions and equations from national sources to produce a standardized analysis that can be replicated in any state where someone can connect state licensing records and supplemental workforce supply surveys to state Unemployment Insurance records. The analysis is not dependent on arbitrary survey participation rates from health system administrators. It takes advantage of transactional data already being produced by state government to add valuable system insights.
Operationalizing Supply Surveys
In 2010 I was hired by the Utah Medical Education Council to design, print, fold and mail out thousands of paper surveys a year by hand. Back then I also built my own data entry data bases and manually entered all of my survey responses. I would then clean and process the data using SPSS and Excel. Finally, I would type up my analysis and paste in all of the tables, charts and graphs into a PDF and send that to be printed and spiral bound. I’ve taught others this process while simultaneously making small improvements every year since. The problem with this process is that we are using 20th century tools to do work that could be much improved using modern analytics tools. As I looked at our past survey work, I found that our response rates were beginning to tank. We went from high 60% range responses in the first decade of surveying the health workforce with mailed paper surveys to the high 20% range by 2020. While this is still a statistically valid sample representing the state of Utah, over time we are losing granularity to describe and model health professions at geographic levels below the entire state such as zip codes or census tracts and further analysis by sub specialty or work setting becomes more difficult. No professionals are surveyed as much as health care professionals. They are over saturated and tired of responding to surveys.
UMEC Health Profession Supply Survey Response Rates 1997 to 2020 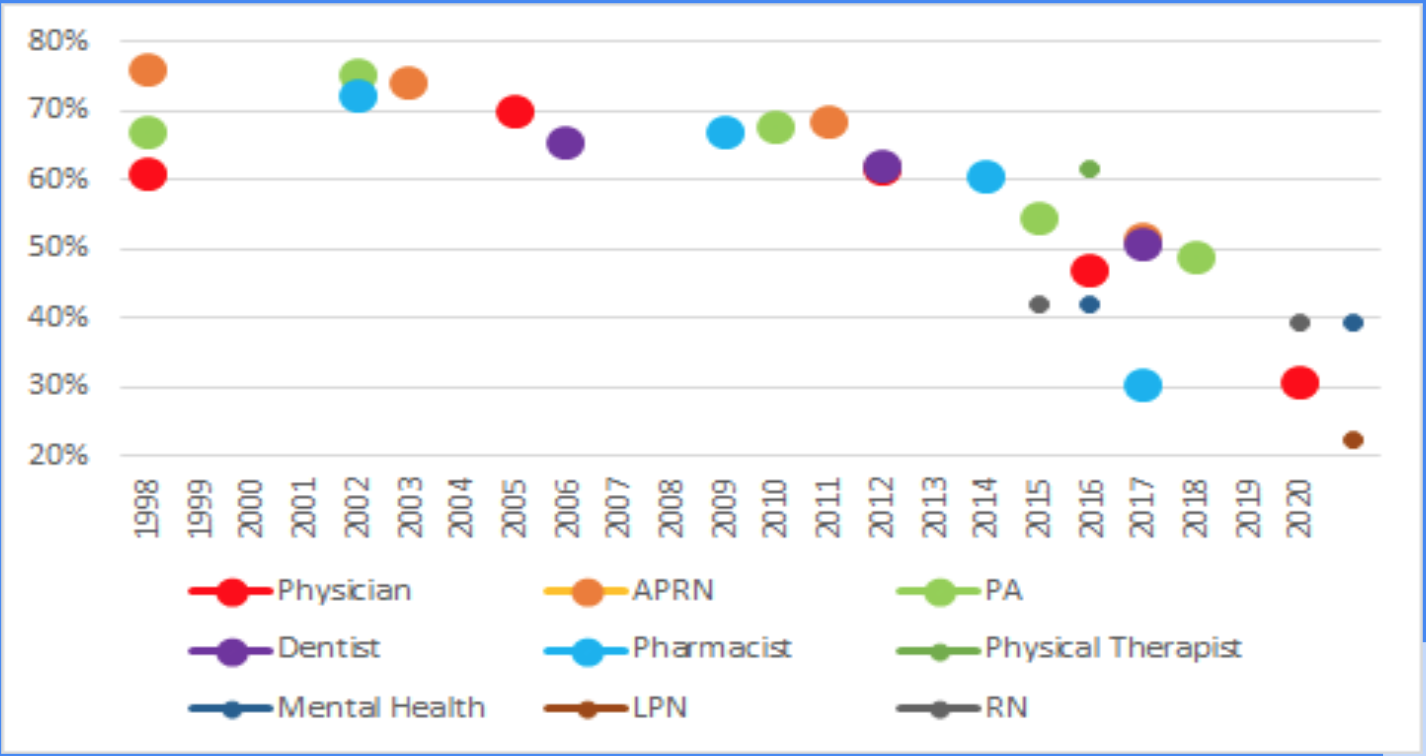
In 2020 I transitioned our data collection process to be fully online. Now I send out invitations to take our surveys to the email addresses on file with the state professional licensing records.
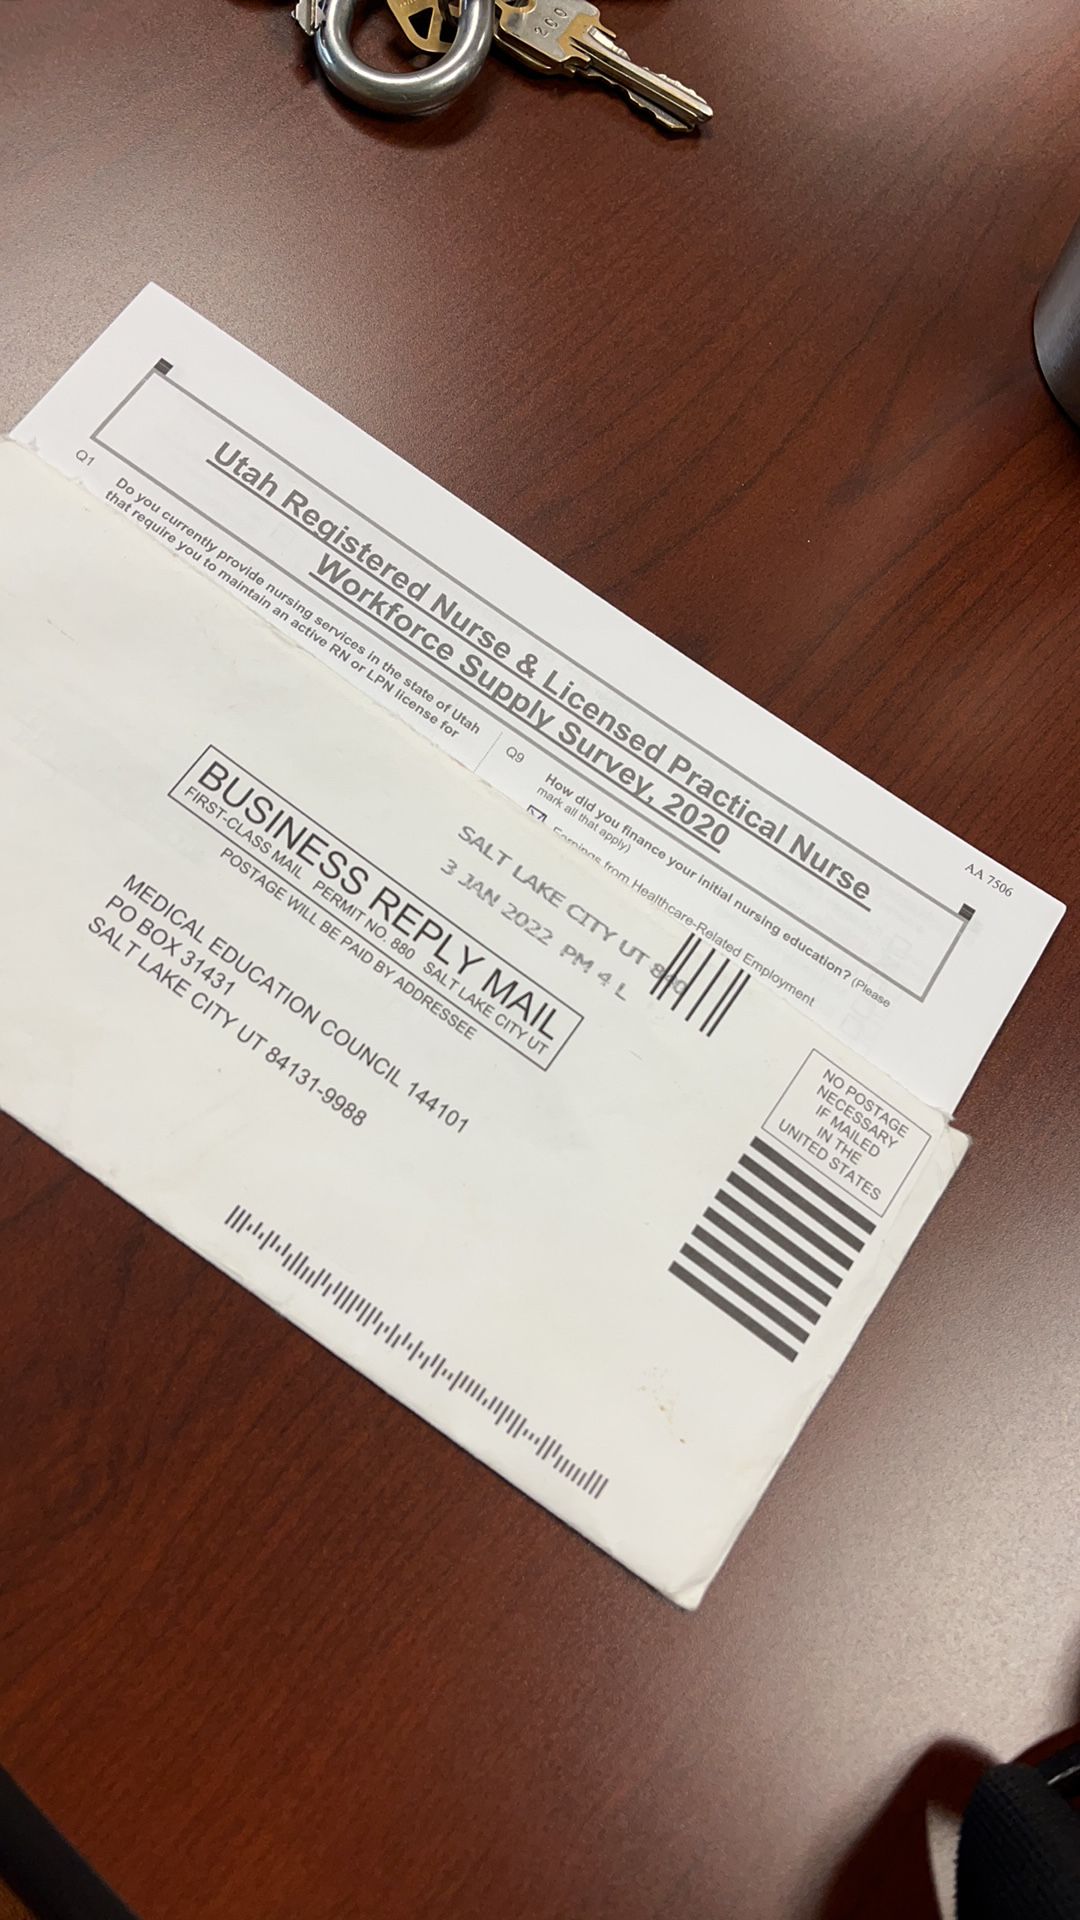
The survey pictured is one of the last paper surveys to ever be returned to the UMEC. This happens every so often. I get a response two years after I sent out the survey (also a year after I published the results of the survey). It always makes me laugh a little and wonder why the person decided to finally send in the response.
Modernization of our data collection process has allowed us to focus more time on advanced analytics and informatics. Last year my team and I modernized our analysis platform with a data warehouse built in an AWS cloud environment We produced our most recent health profession workforce survey on Utah’s Mental Health Workforce using Python and R and piped the analysis to dashboards and report templates in Tableau and R Shiny. This work serves as a code base for us to refine with new health professions analysis as we produce them. We are currently working on an update to our APRN workforce study that will iterate and improve on the templates built for our Mental Health workforce analysis
We have also began to explore application of machine learning to the data we have available to us. From the work my team and I did to clean and standardize our historic data, one of my analysts decided to use our datasets for his capstone project to complete his Masters of Statistics. We ended up with a paper published in 2022 from his work, in the Journal of Rural and Remote Health. Using ML to Predict Rural Practice Decision in the Health Workforce We are excited to continue to build off of this work as we further automate our data collection, cleaning, transformation and storage processes.
IBM Utah Teamcare Model
In 2017, the Utah Area Health Education Centers at the time, under the direction of Michael K. Magill,MD, convened its first annual Primary Care Summit.
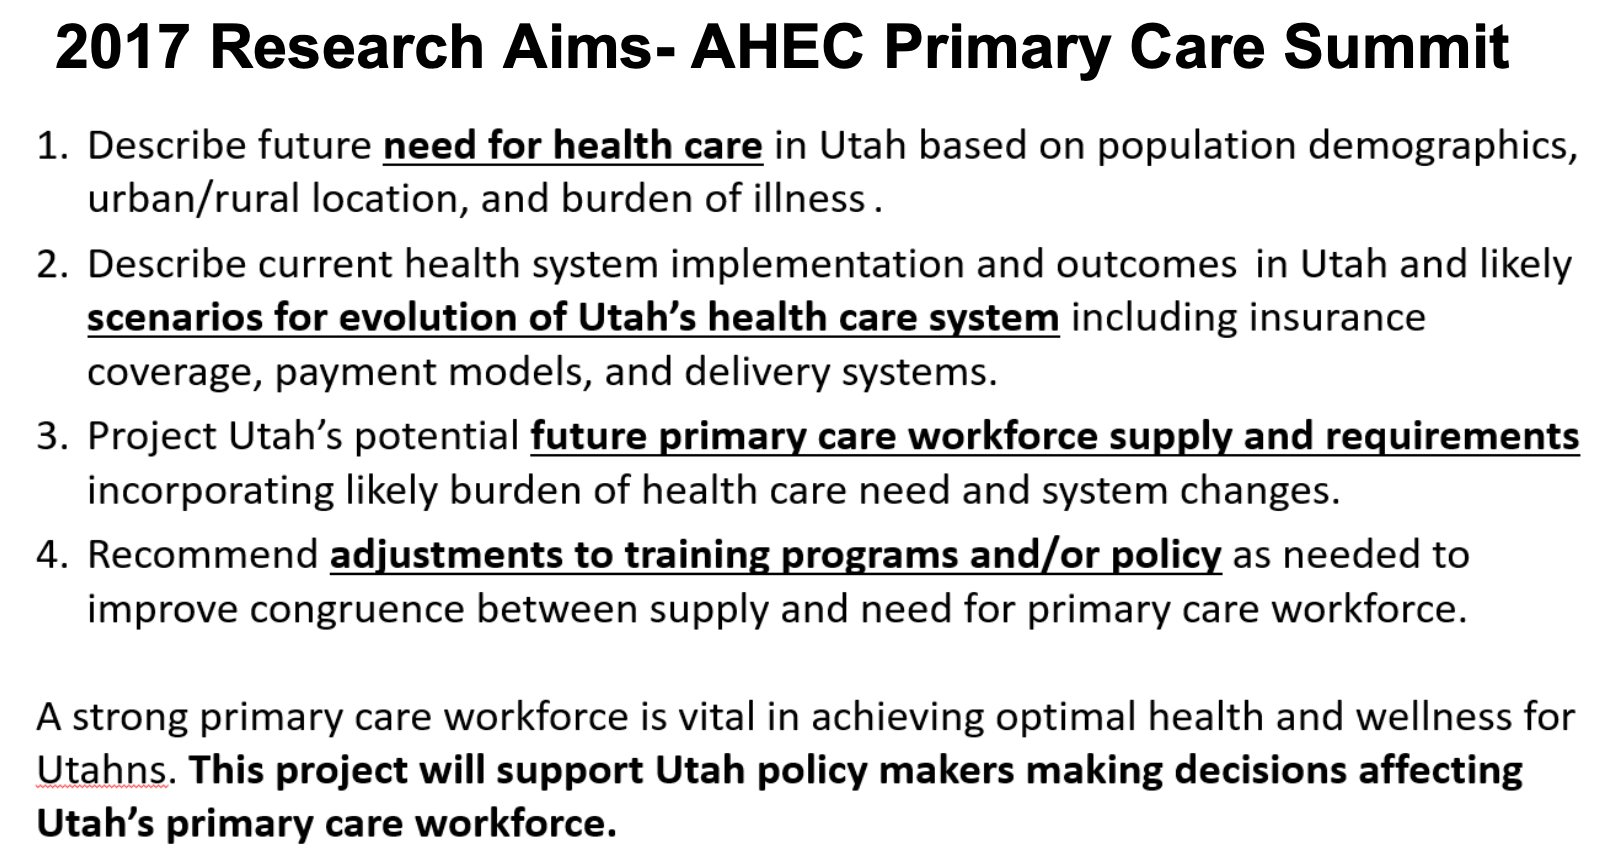
My office contributed funding to Dr. Magill to begin to pursue his stated research aims. I began meeting with Dr. Magill to understand how I could support his work with data and analysis. As we met together and brainstormed ideas we decided that we wanted to come up with a way to calculate population health need in comparison to workforce supply and compare the number of FTEs required to provide all primary care needs for the Utah population to the number of FTEs in the primary care workforce in the state.
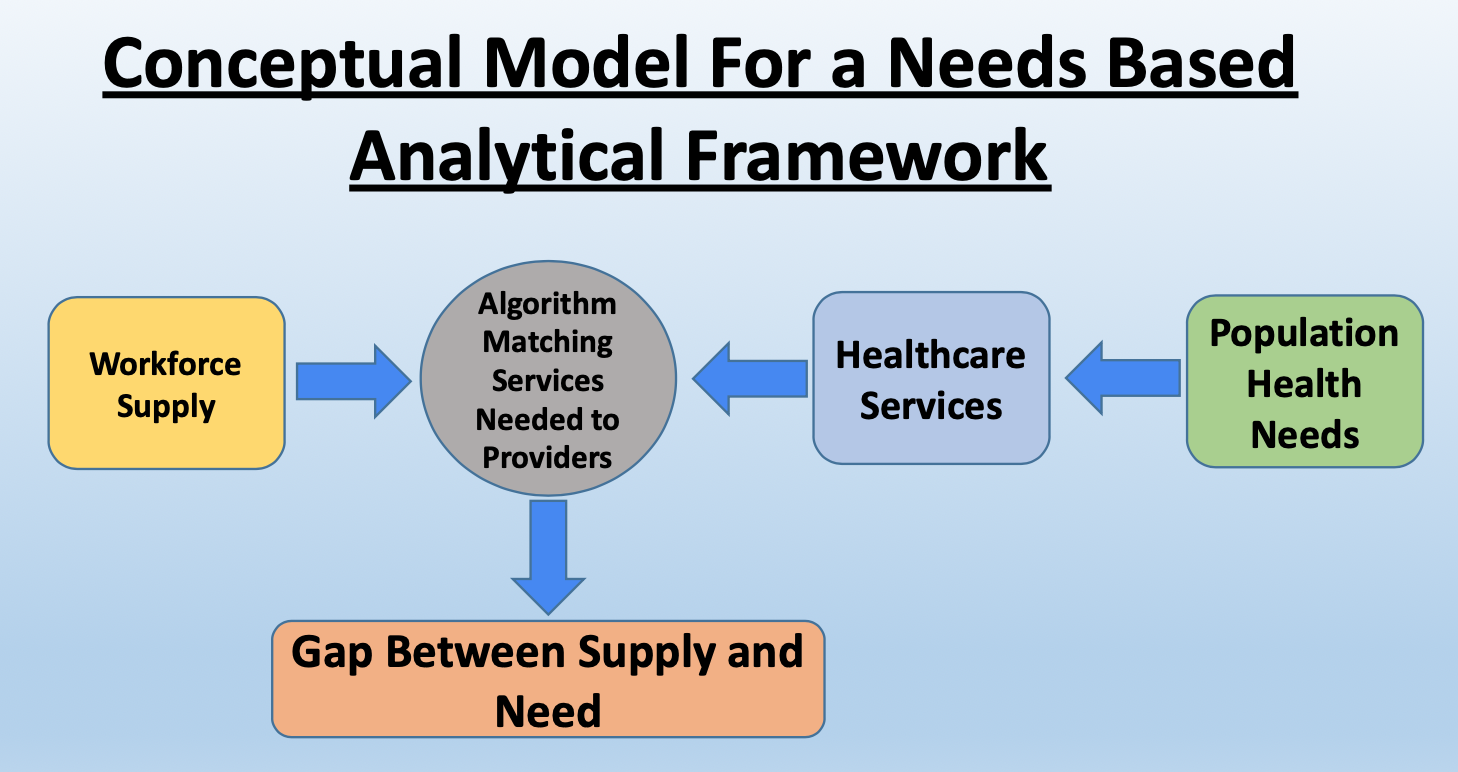 I began to explore data sources to represent population health needs and started working on a prototype calculation model using Microsoft Excel. Through Dr. Magill’s national contacts we were made aware of the IBM Healthcorps. We were told that they were looking for a health workforce project to get involved with. I wrote up our proposal and we were awarded an in-kind work grant for a team of IBM designers, architects and data scientists to come and work on our project. I produce a poster about our concept and was accepted at the Academy Health, National Health Policy Orientation in the summer of 2018 to present the work.
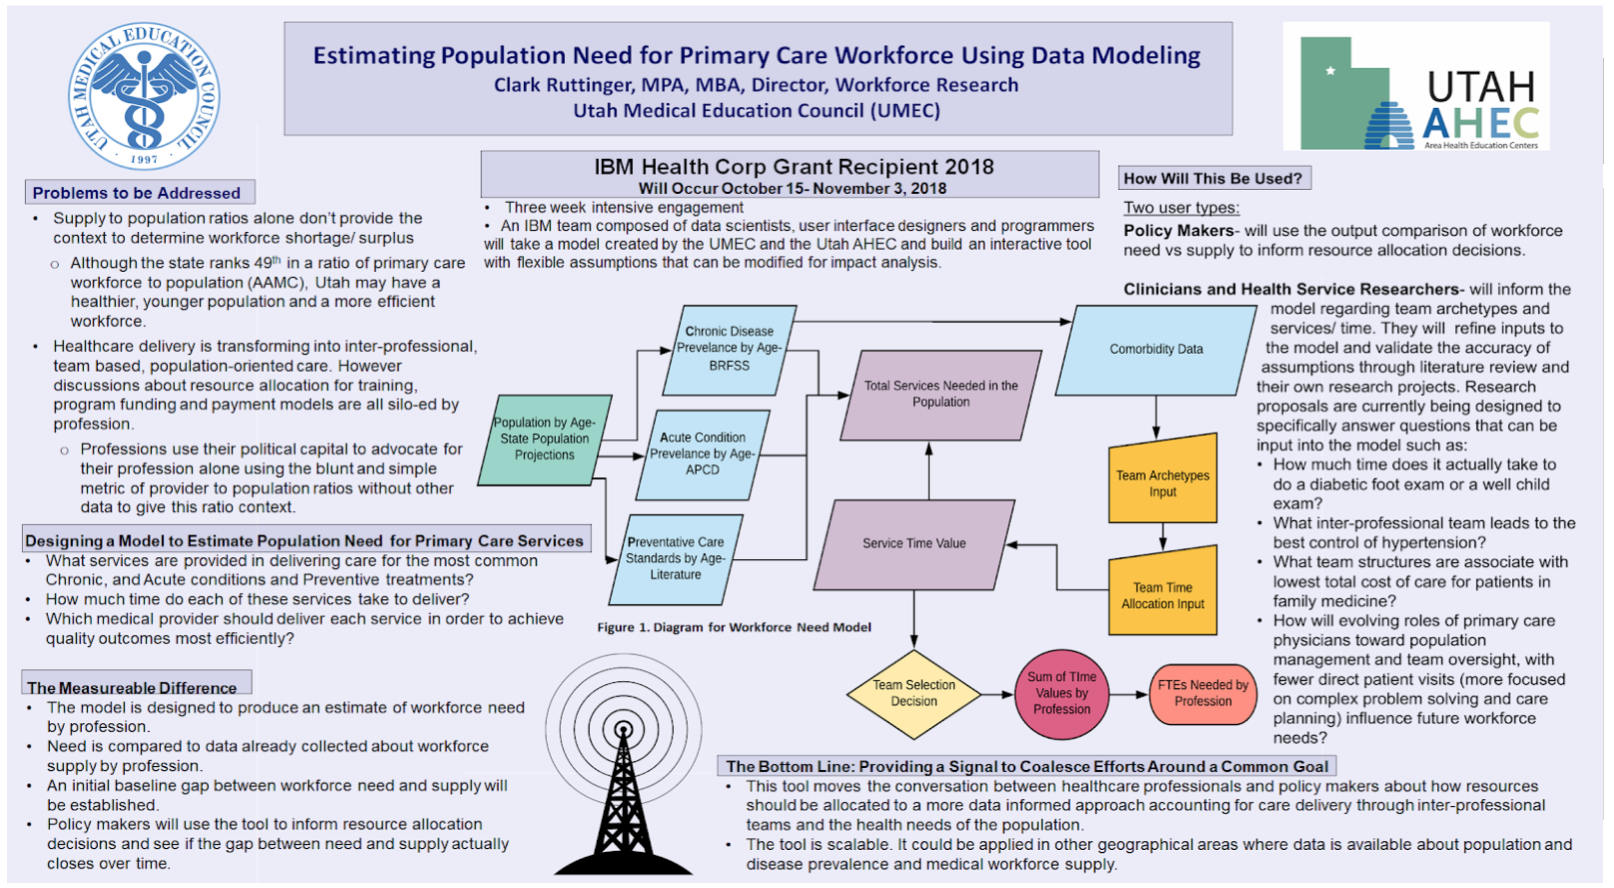
The IBM team spent three weeks with our research team. We met with their data scientist first to explain the Excel model and concept. IBM had us organize health stakeholders across the state to engage in design sessions with their user interface designers. The IBM team asked stakeholders three questions.
How do you currently design education programs/ make program decisions today?
What is the current process for allocating or designing care teams within a practice today?
How do you make decisions on healthcare allocations today?
The design team explained to me that their goal was to take a survey of the entire ocean that is health workforce policy making in Utah. Then they would decide with our help, where in that ocean to dip their teacup and then they would boil that cup of ocean down to its essence. As I worked with the team over three weeks I had the extraordinary privilege to watch the process of IBM Design thinking unfold. At the end of the engagement, we had a functioning minimum viable modeling product built in Python, React, Node JS and Docker, along with documentation of how the application works and a plan for how to move forward with building on the initial IBM work.
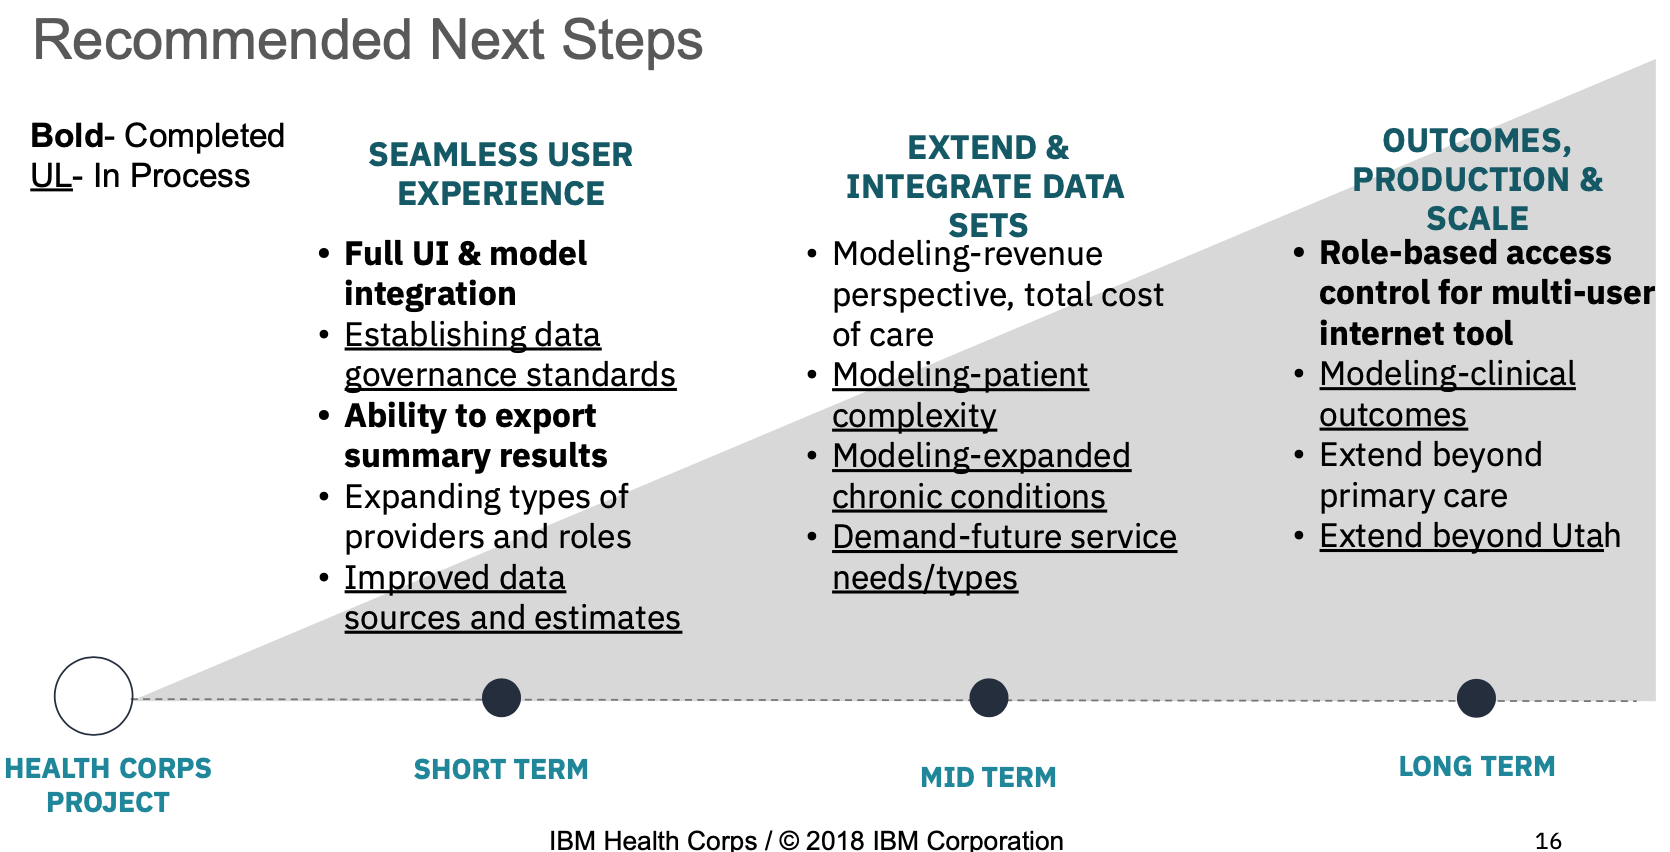
The model produces three specific outputs.
Ideal provider staffing
- Given population need, what would be an optimal provider team composition (ie: types and number of providers)
Ideal provider staffing constrained by current providers composition
- Given population need and current provider composition, what would be an optimal provider team composition?
Ideal service/ task allocation
- Given providers current composition, what would be an optimal task/service allocation?
Since the engagement I have continued to meet with Dr. Magill on a weekly basis. We have convinced others to join us. We have been able to advance the project through some growth over the last few years. We secured funding from the Utah State Legislature in 2019 to build out designs created by IBM of a front end, web-based user interface for the model. The model and interface are running on a state of Utah domain and can be examined at https://teamcare.utah.gov The model is currently loaded with prototype data. Users can create their own load of the model by providing data they deem sufficient to the input requirements and can save their own profile and modeling outputs.
Work on the Utah Team Workforce Model continues today.
Current work is focused on three aims:
- Load the model with available data sources
- Validate model inputs with real world observational studies
- Assess usability of the tool with users
We are currently developing and submitting research proposals related to each of these aims. the team is also conducting literature review on the application of machine learning to claims databases to explore how we want to approach loading the source data on patient populations into the model as patient archetypes based on primary care utilization patterns.
Over the last year, I built a graph database of three years of data from the Utah All Payers Claims Database to explore how to create patient archetypes within the Utah population, clustered by utilization patterns to represent patients in the model.
National Forum Data Interconnection
The National Forum of State Nursing Workforce Centers is a not-for-profit membership organization with member centers in 38 states. a Member entity in each state is designated as the state workforce center. Since 2015, I have participated with the National Forum as Utah’s Center Director. The centers engage in advocacy for the nursing profession and share best practices in advancing national nursing goals. The National Forum produces and maintains the National Minimum Nursing Data Set (MDS) recomendations for gathering supply, demand and education data about nurses in each state.
As I became involved with the National Forum, I became acquainted with nursing center directors across the country. Many of these centers are dedicated to running nursing education programs and advocating for policy change at the state level. The large majority of these center directors were nurses of a certain age. These nurses have vast experience in the profession. They are masters of taking information and initiating change in their states. They are a deep network of nursing expertise in the country on every subject related to nursing workforce policy and planning.
In 2018, I joined the board of the National Forum and served as Board President from 2019 to 2020. During that time I was able to engage in a project and discussions with colleagues in various states about how to collect, analyze and share information about the nursing workforce across the country.
I proposed that states with National Forum presence each submit a set of aggregates based on the National Forum’s supply MDS from the data collected about the nursing workforce supply in their state to a template that I worked to develop with others on the National Forum’s research committee. I had a member of my work team throw together a national map in Tableau to show the submission data from each state.
The purpose of this project was to create a national picture of the nursing workforce in each state from the entities producing state level nursing workforce data and analysis. This, I argued, would produce a better picture of the national nursing workforce than top down, national nursing surveys produce. The information would be coming from the bottom up and could be updated at regular intervals coinciding with when states updated their state level nursing supply surveys.
I worked with Forum members to understand how the template for data submission would work best. I presented at Forum meetings and conferences on the idea. Ultimately, out of 38 member states, I was only able to get 10 of them to submit their aggregated data to our Tableau dashboard. These 10 states are the states with the most alignment around data collection and analysis managed or controlled in some way by the state nursing workforce center. States who did not submit had different reasons for not submitting. They were not the ones producing the data or they did not have the skills, knowledge or budget to have the data aggregated in the way we set up. Ultimately, the low participation in this project showed the Forum that they have work to do in terms of improving engagement with member states and building connections within states to the people who know how to analyse health workforce data. I continue to interact with the National Forum on a volunteer basis and seek to find ways to produce new projects analyzing workforce migration and interstate compact participation across the country.
Utah Health Workforce Coalition
In early 2018, I was invited by the National Governors Association to participate in a policy engagement they were holding around health workforce. They flew me and three other representatives from Utah they had identified as key health policy influencers to their offices in DC to talk with them about what states were doing to improve access and quality to data to inform better health policy. We were introduced to Dr. Hannah Maxey from the Bowen Center for Health Workforce Policy at the University of Indiana Medical School. She presented to us the work she has done in advancing health workforce policy in her state and provided us with a template for thinking about how to approach identifying all players within the system in our state and how we would go about approaching change.
Later, in October of 2018, I was invited along with a colleague from the Utah Office of Primary Care and Rural Health (OPCRH) to submit a proposal for how we would go about making change to improve the use of data to impact health workforce policy in Utah.
The OPCRH is the office that calculates the Health Professional Shortage Area designations for HRSA in Utah. This calculation is done through an antiquated process of gathering survey data and hiring an army of phone surveyors to call clinics across the state and validate the survey responses. It is a process that is done independent of any other data collection processes in the state. It needed to be improved with a new methodology that uses 21st century tools.
Our proposal was to integrate the supplemental workforce supply surveys that my office has done since 1997 with the license renewal process for health professional licenses in the state and to collect the information required for calculating HPSAs from this survey. We proposed to create use cases around the Nursing Workforce and the Mental Health workforce in order to involve key stakeholders in those professions and to align with focusing issues that were already emerging in Utah about concerns over shortages of nursing and mental health providers to meet demands of a growing population with increasing healthcare needs.
The OPCRH had access to funding from HRSA to hire a coordinator to engage with stakeholders in the state around this idea. We created the Utah Health Workforce Coalition with the mission of having a diverse, well-qualified and sustainable workforce that equitably meets the needs of all Utah residents, with emphasis for those in rural and underserved areas. We hired Dr Maxey to take us through the process of developing a strategic plan for how we would make change. Out of the work of many hours of discussions with this coalition of stakeholders we came up with a plan that recommended legislation to integrate supplemental supply surveys with the state licensing process and to create an advisory council within state government to guide and approve survey questions and analysis that would come from this data collection.
At this point in time I had a long history of talks with legislators and various health professional stakeholders about how we could make change in Utah. They all saw the need for change. We were lacking the political will to make the change though. The onset of the pandemic became an accelerator and a focusing event on showing the desperate need for improvements to our system for informed decision making around health policy.
After engagements with many states on the question of how to leverage data for better health workforce policy, the NGA produced a brief to inform governors and states about how to go about this important work.
With our strategic plan in hand and the obvious need demonstrated by the pandemic, we approached Utah Representative Norman Thurston, to consider a bill. He was of course already well aware of our work and well prepared to take this plan and run with it. HB 176 The Utah Health Workforce Act. was passed in the 2022 Utah Legislative session with broad support and no substantive opposition.
I’m hopeful for the improvements that will come with the passage of this act! I look forward to what the changes will bring in terms of improved collaboration in improving health policy in Utah. We are moving from a situation where everyone is touching different parts of the elephant,
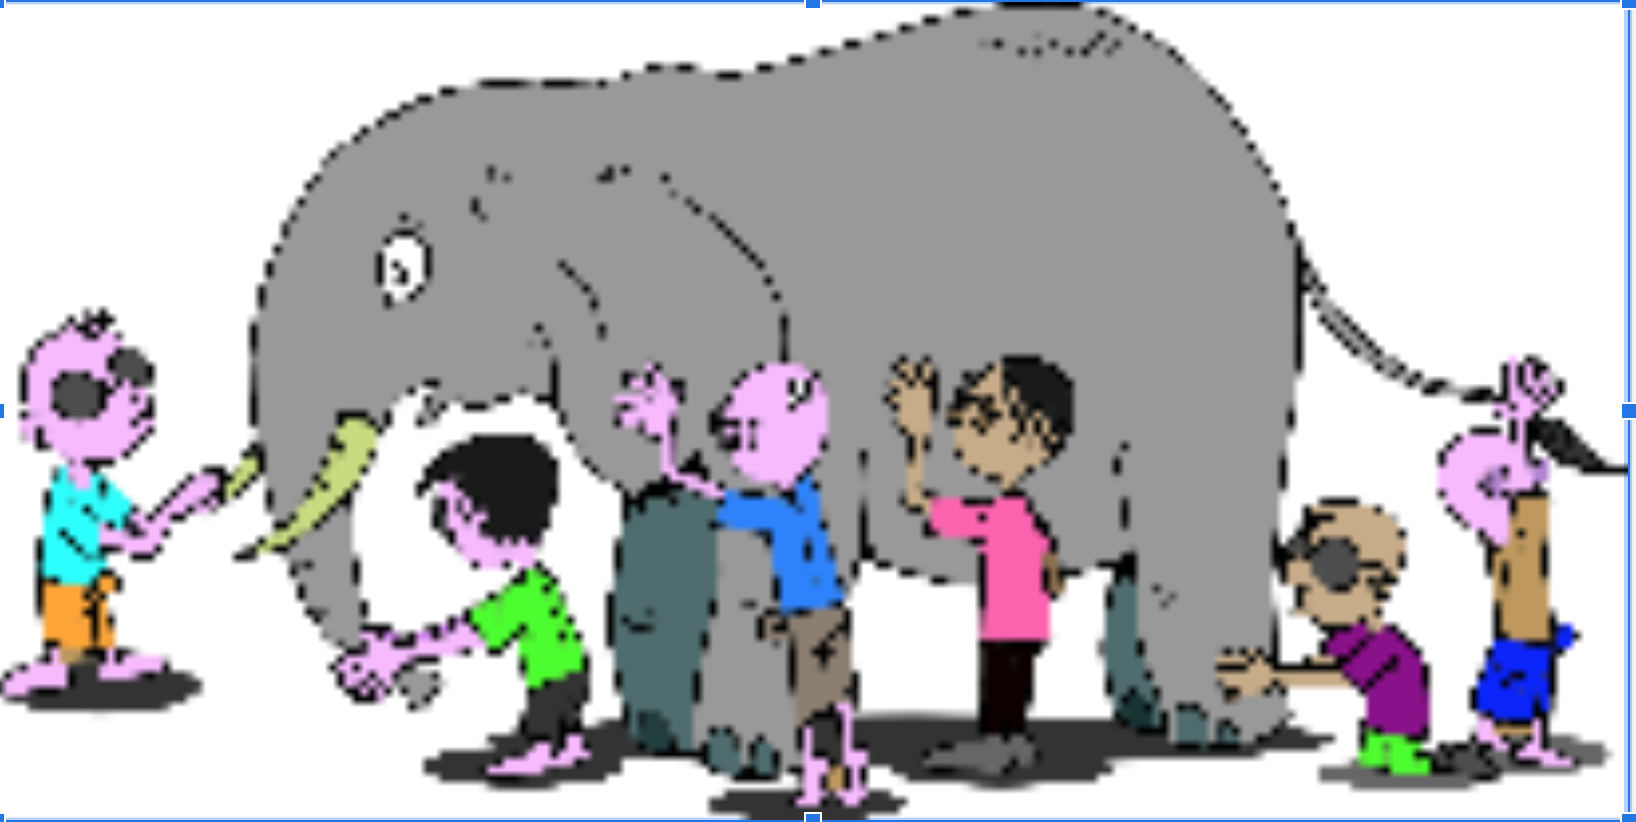
to a a form more like a beehive where we are working together for common goals. Quite appropriate for the Beehive State!

Modeling a Health Workforce Data Warehouse
For all of the survey work I’ve done over the last 12 years, I have designed and built data entry databases in Microsoft access or survey scanning software like SNAP for OCR scanning and Qualtrics for online surveys. I built data entry databases for companies we contracted ocasionally for larger projects like the 2015 Utah RN Workforce Supply Survey.
As I finished my MBA electives with a certificate in Information Systems I became interested in how to consolidate and better connect annual surveys I had administered over years at the UMEC to other data sets I had access to for analysis.
As a final project for a class in data warehouse design, I designed a small data warehouse to store a survey collected from an annual survey of nursing deans across the state of Utah in collaboration with the Utah Organization of Nurse Leaders, Academic Leadership Committe.
I developed that work with my team at the UMEC into a Tableau dashboard about Utah Nursing Workforce Education. This survey is updated annually as data is submitted from nursing programs.
in July of 2018 I hired a computer science undergrad as an intern and I assigned one of my research analysts to work with me to design a data warehouse of all of the health professional workforce supply surveys that had been produced by the UMEC since they started collecting them in 1997.
These surveys had been administered in different years to different health professions. With each survey administration there were small changes made to survey instruments to add questions or change wording. Because of regular staff turnover, there had never been much standardization to the survey process.
I started with a literature review to find database designs that solved a similar problem of using a dimensional data warehouse to standardize historical survey data.
The solution we built using MySQL contained 6 tables in total:
The fact table stores all the responses for each respondent.
Dim Survey stores survey information such as the surveys’ types, year, population, number of respondents and weight.
Dim Respondent stores respondent information such as their license numbers, NPI, gender, date of birth and age.
Dim Question stores question texts and their corresponding master variables for standardization.
Dim Response stores response texts for certain questions that provides fixed answers for respondents to choose.
Dim Identifier stores different weight types.
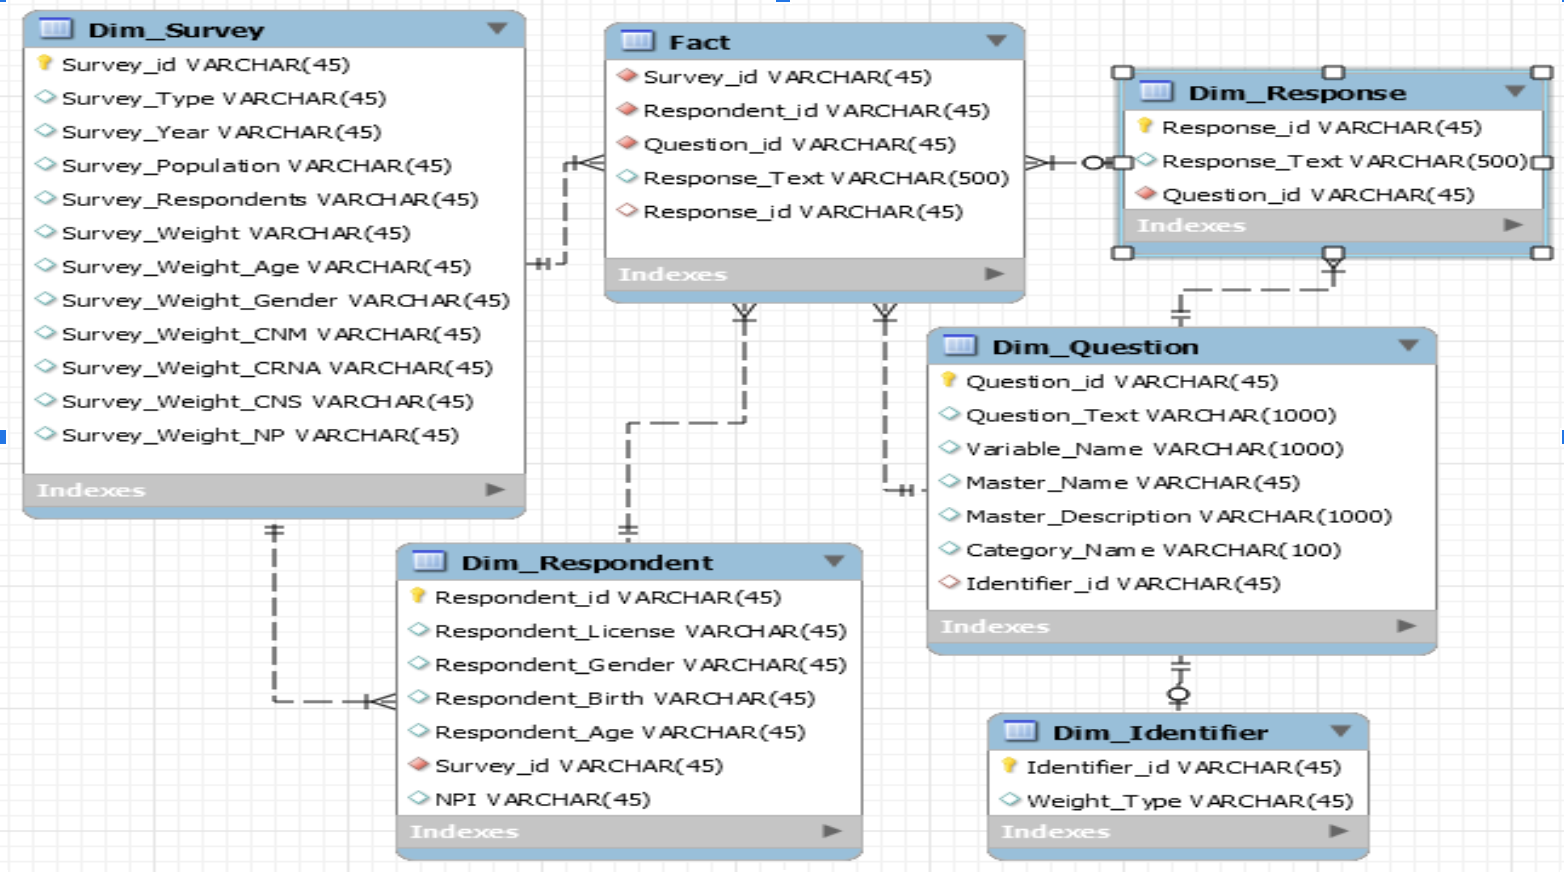
I had my team validate the results of our work against our previously published analysis using the same data. They wrote up their work and presented it to the UMEC..
My team and I have since iterated this design and produced a 2.0 version of our DW in our Amazon cloud environment. Primary changes were to organize surveys into better categories so that it is easy to identify questions universal to all professions in all years (demographics and hours worked for example), questions specific to a profession(eg: residency location or work setting) and questions that are both profession and year specific (eg: how many babies do you as a CNM deliver each year).
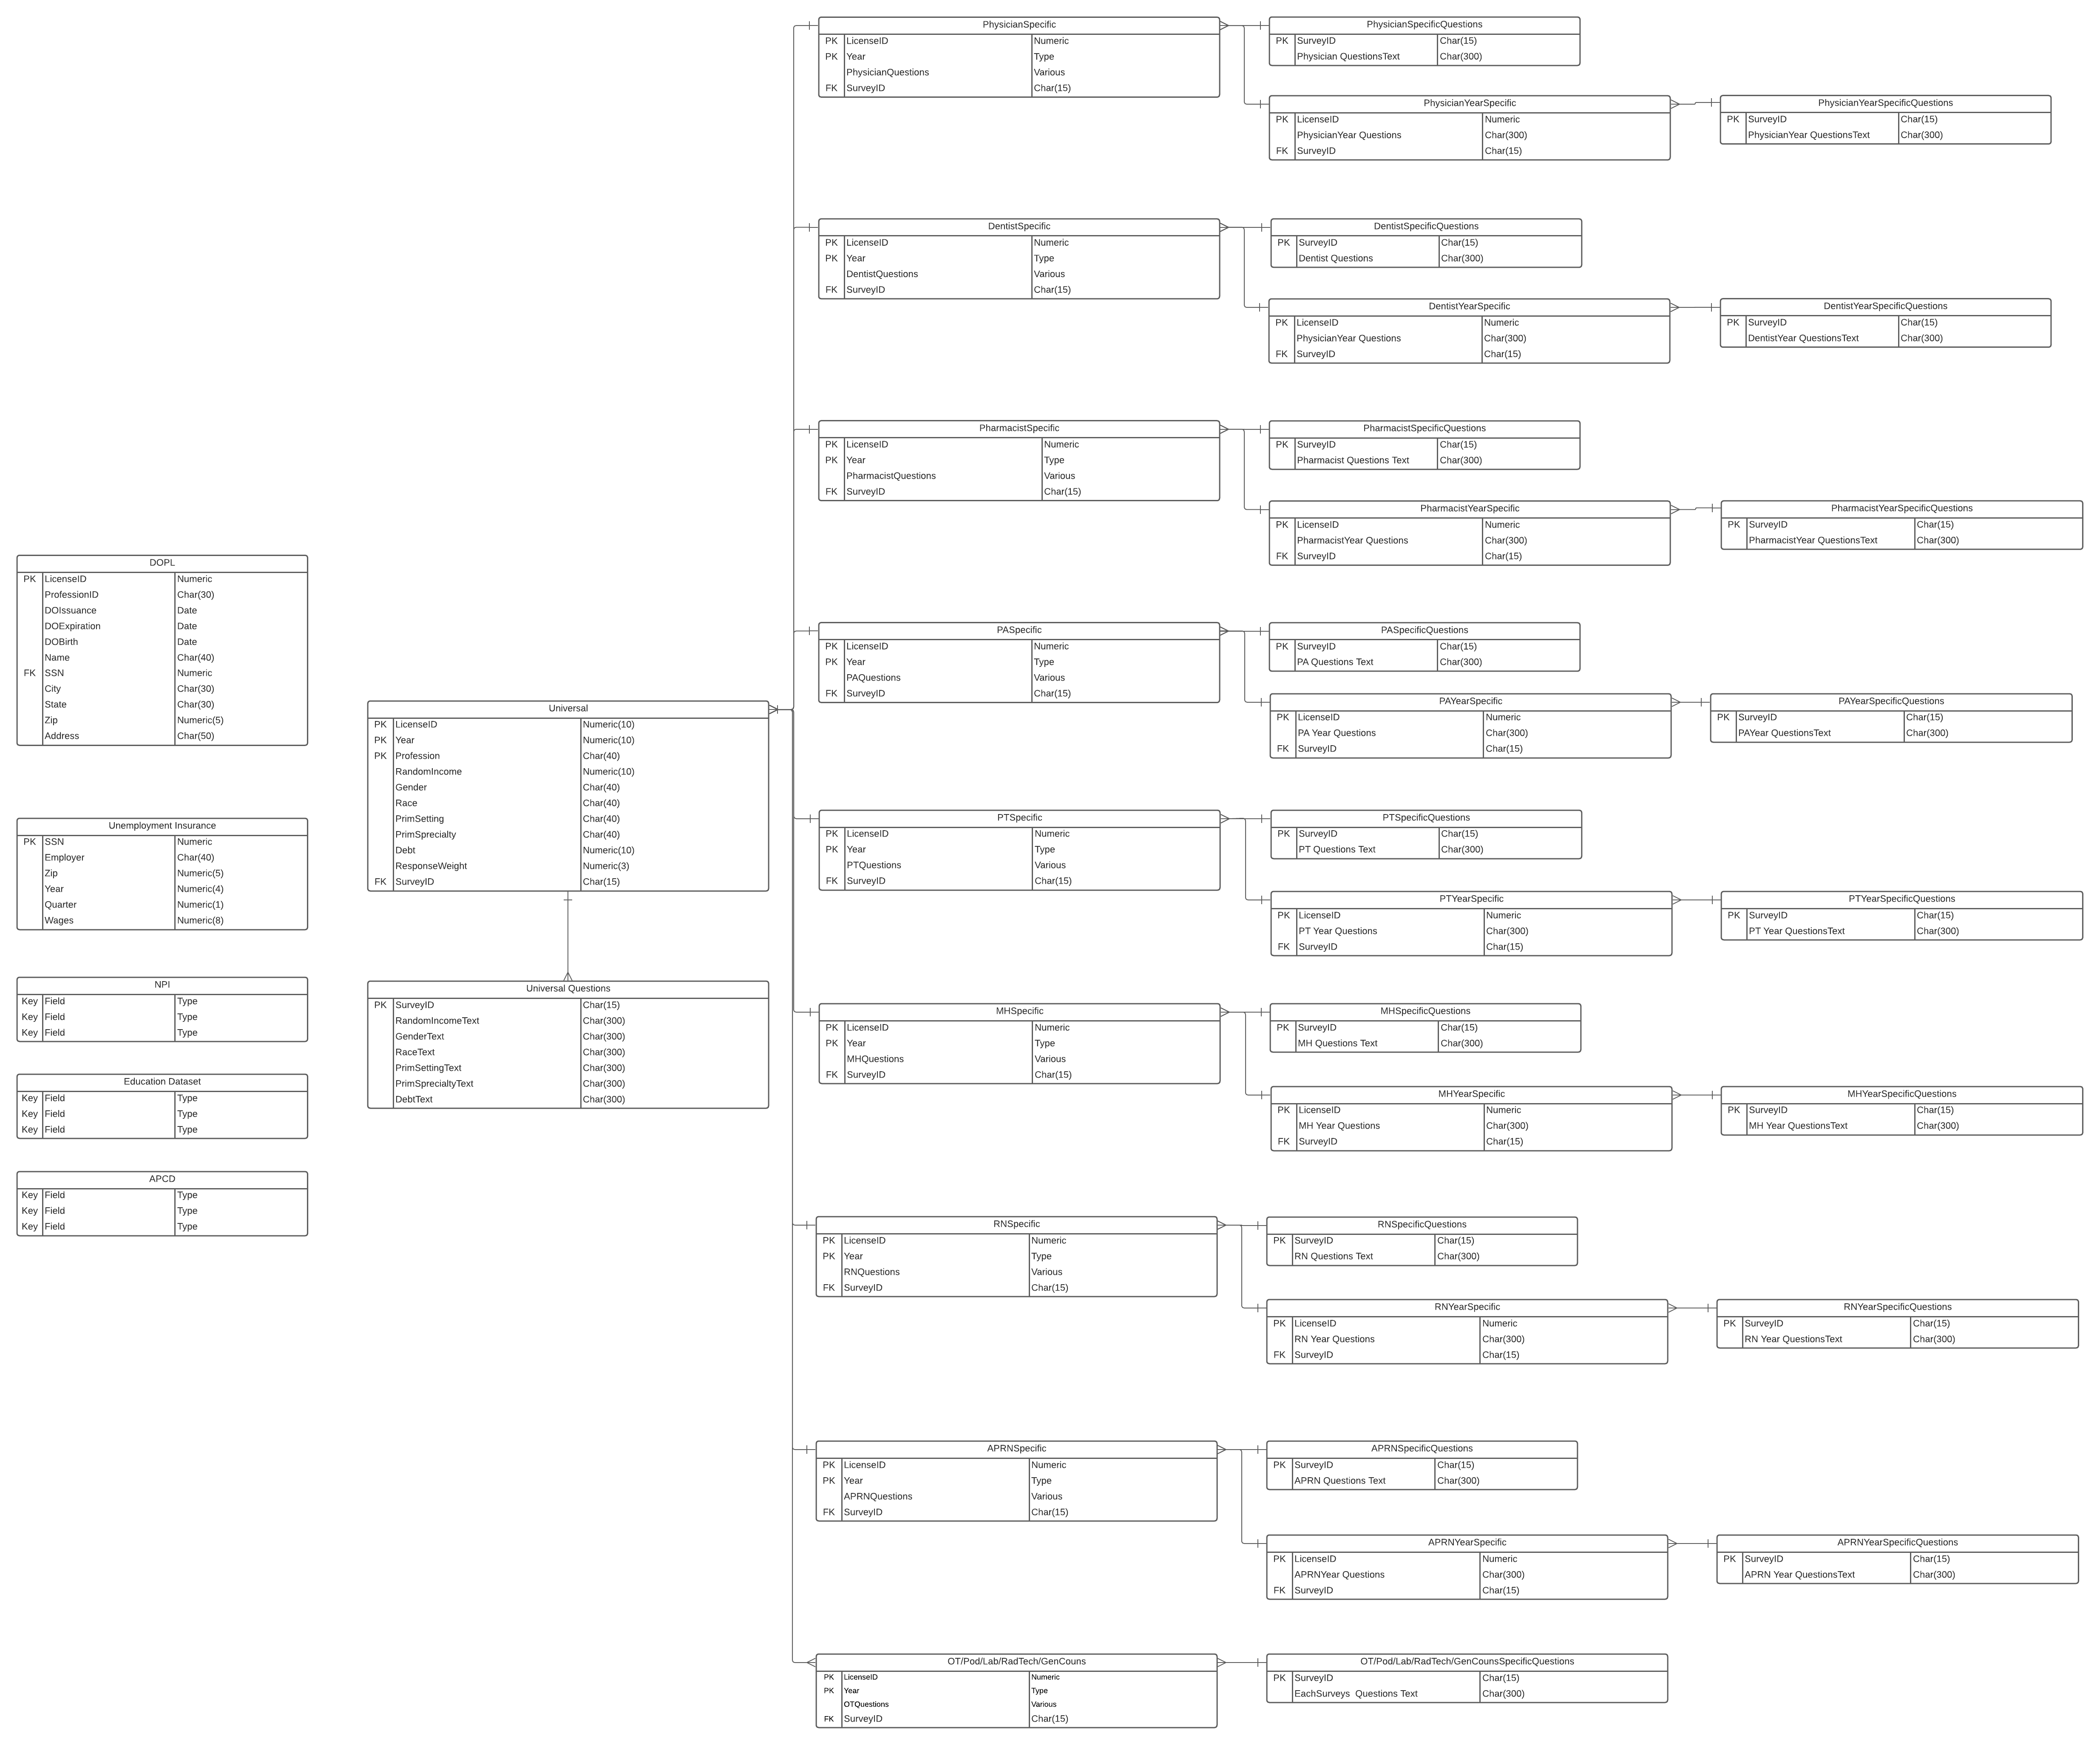
We are currently working on connecting this schema to Tableau dashboards to provide workforce and profession specific information and to feed future workforce reporting and analysis.
We are also working to interconnect additional government, public and private data sets into our data model.
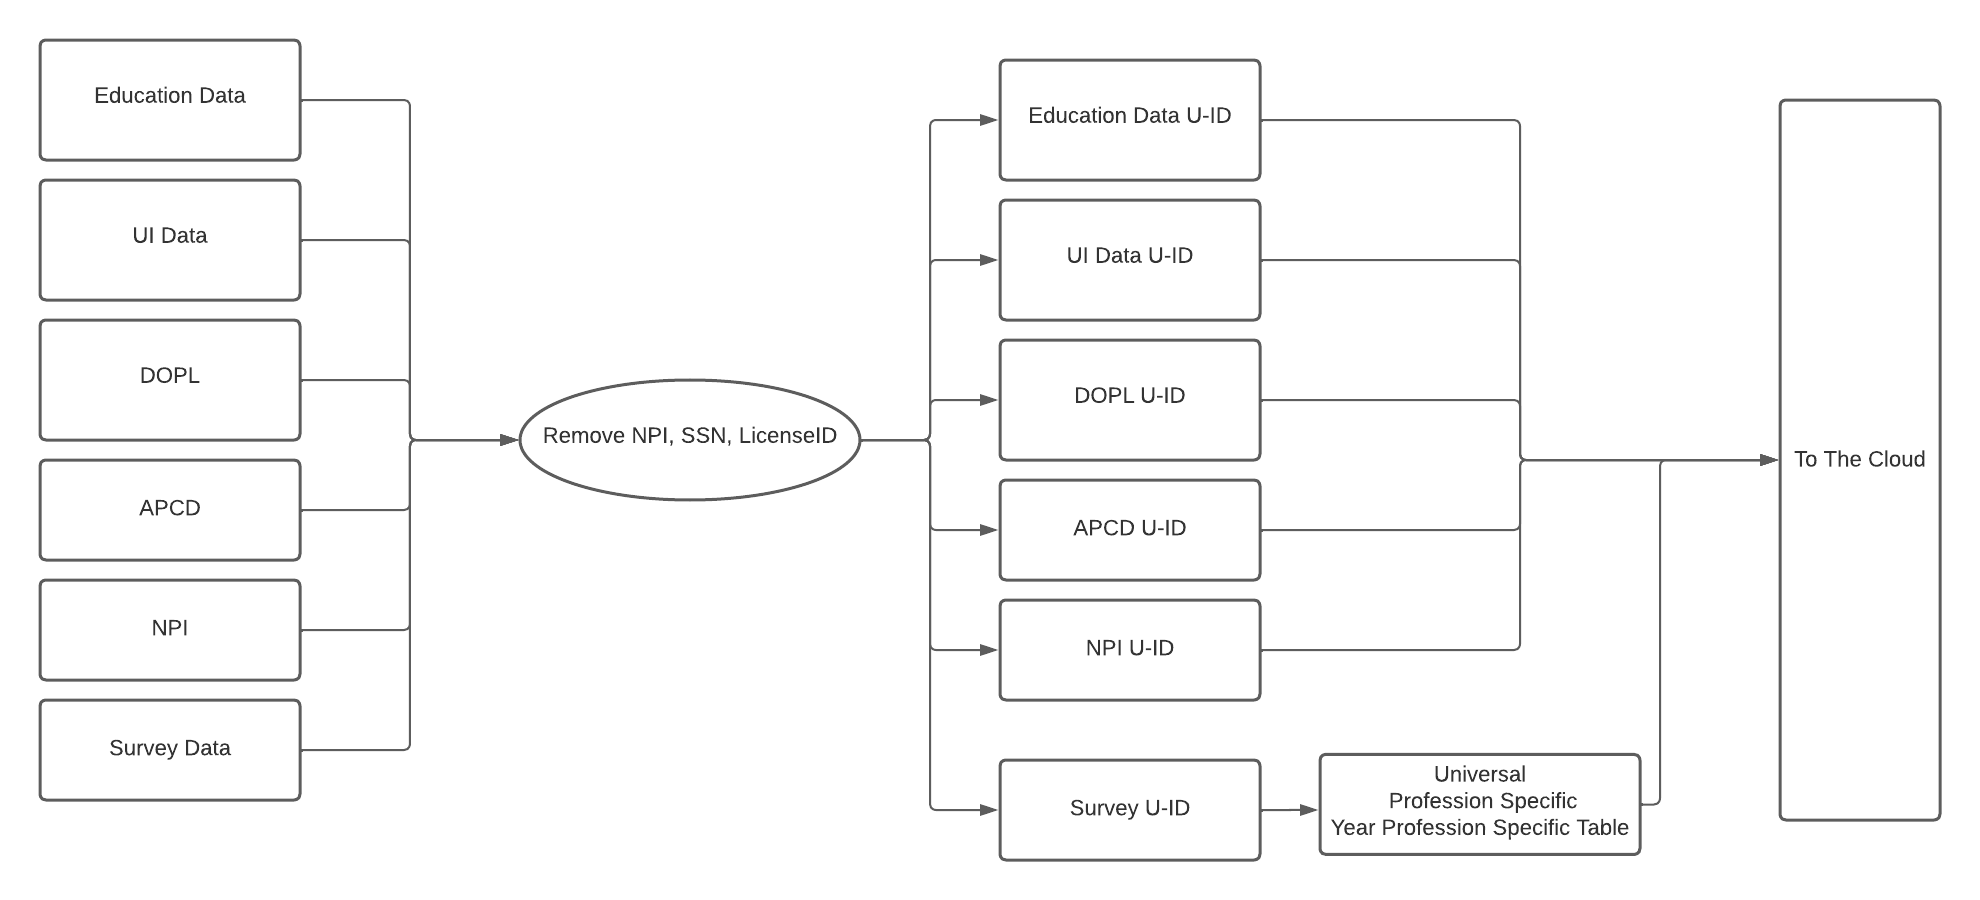
Long term intentions are to map to a standard such as the OMOP Common Data Model so that we can produce more standardized analysis that can be replicated and compared across the country.
Modeling a Graph Database in NEO4J
Out of the application design engagement my research team was awarded with IBM, we began to develop an understanding of what we needed to do to create a data set representative of all primary care service needs in the Utah state population.
As I spoke at conferences and networked with people about our modeling ideas, I met a brilliant nurse informaticist working for the VA a the time named Stephen Weaver who suggested that I look into creating a knowledge graph as the solution. A knowledge graph is defined as- a collection of interlinked descriptions of entities – objects, events or concepts. Knowledge graphs put data in context via linking and semantic metadata and providing a framework for data integration, unification, machine learning, analytics and sharing.
As the pandemic hit and we were all isolated at home, Stephen and I decided to have weekly Zoom meetings to talk about ideas and collaborate on a knowledge graph project in a graph database platform called NEO4J together.
We decided that our approach would be to model a graph database of 3 years of the Utah All Payers Claims Database(APCD) so that we could easily run various clustering machine learning algorithms to look for utilization patterns in the data to identify patient archetypes in the population. This approach had several benefits.
Knowledge graphs apply semantics to give context and relationships to data, providing a framework for data integration, unification, analytics and sharing. They are a flexible means of discovering facts and relationships between people, processes, applications and data, in ways that give companies new insights into their businesses, create new services and improve R&D research.
The NEO4J Community Edition is free and open source. This allowed us to build our prototype with only the cost of the sweat equity we were willing to contribute.
NEO4J Community Edition also comes as a server version that can be deployed in an AWS environment and accessed through a web browser with a user login. This allowed us to securely load and host our graph on a domain hosted by the State of Utah. We were able to allow specific members of our research team to access the graph and continue to work together while we were all living separately through a global pandemic.
We began with submitting a request to the Utah Office of Healthcare Statistics that manages the state APCD to receive the data we wanted to analyze.
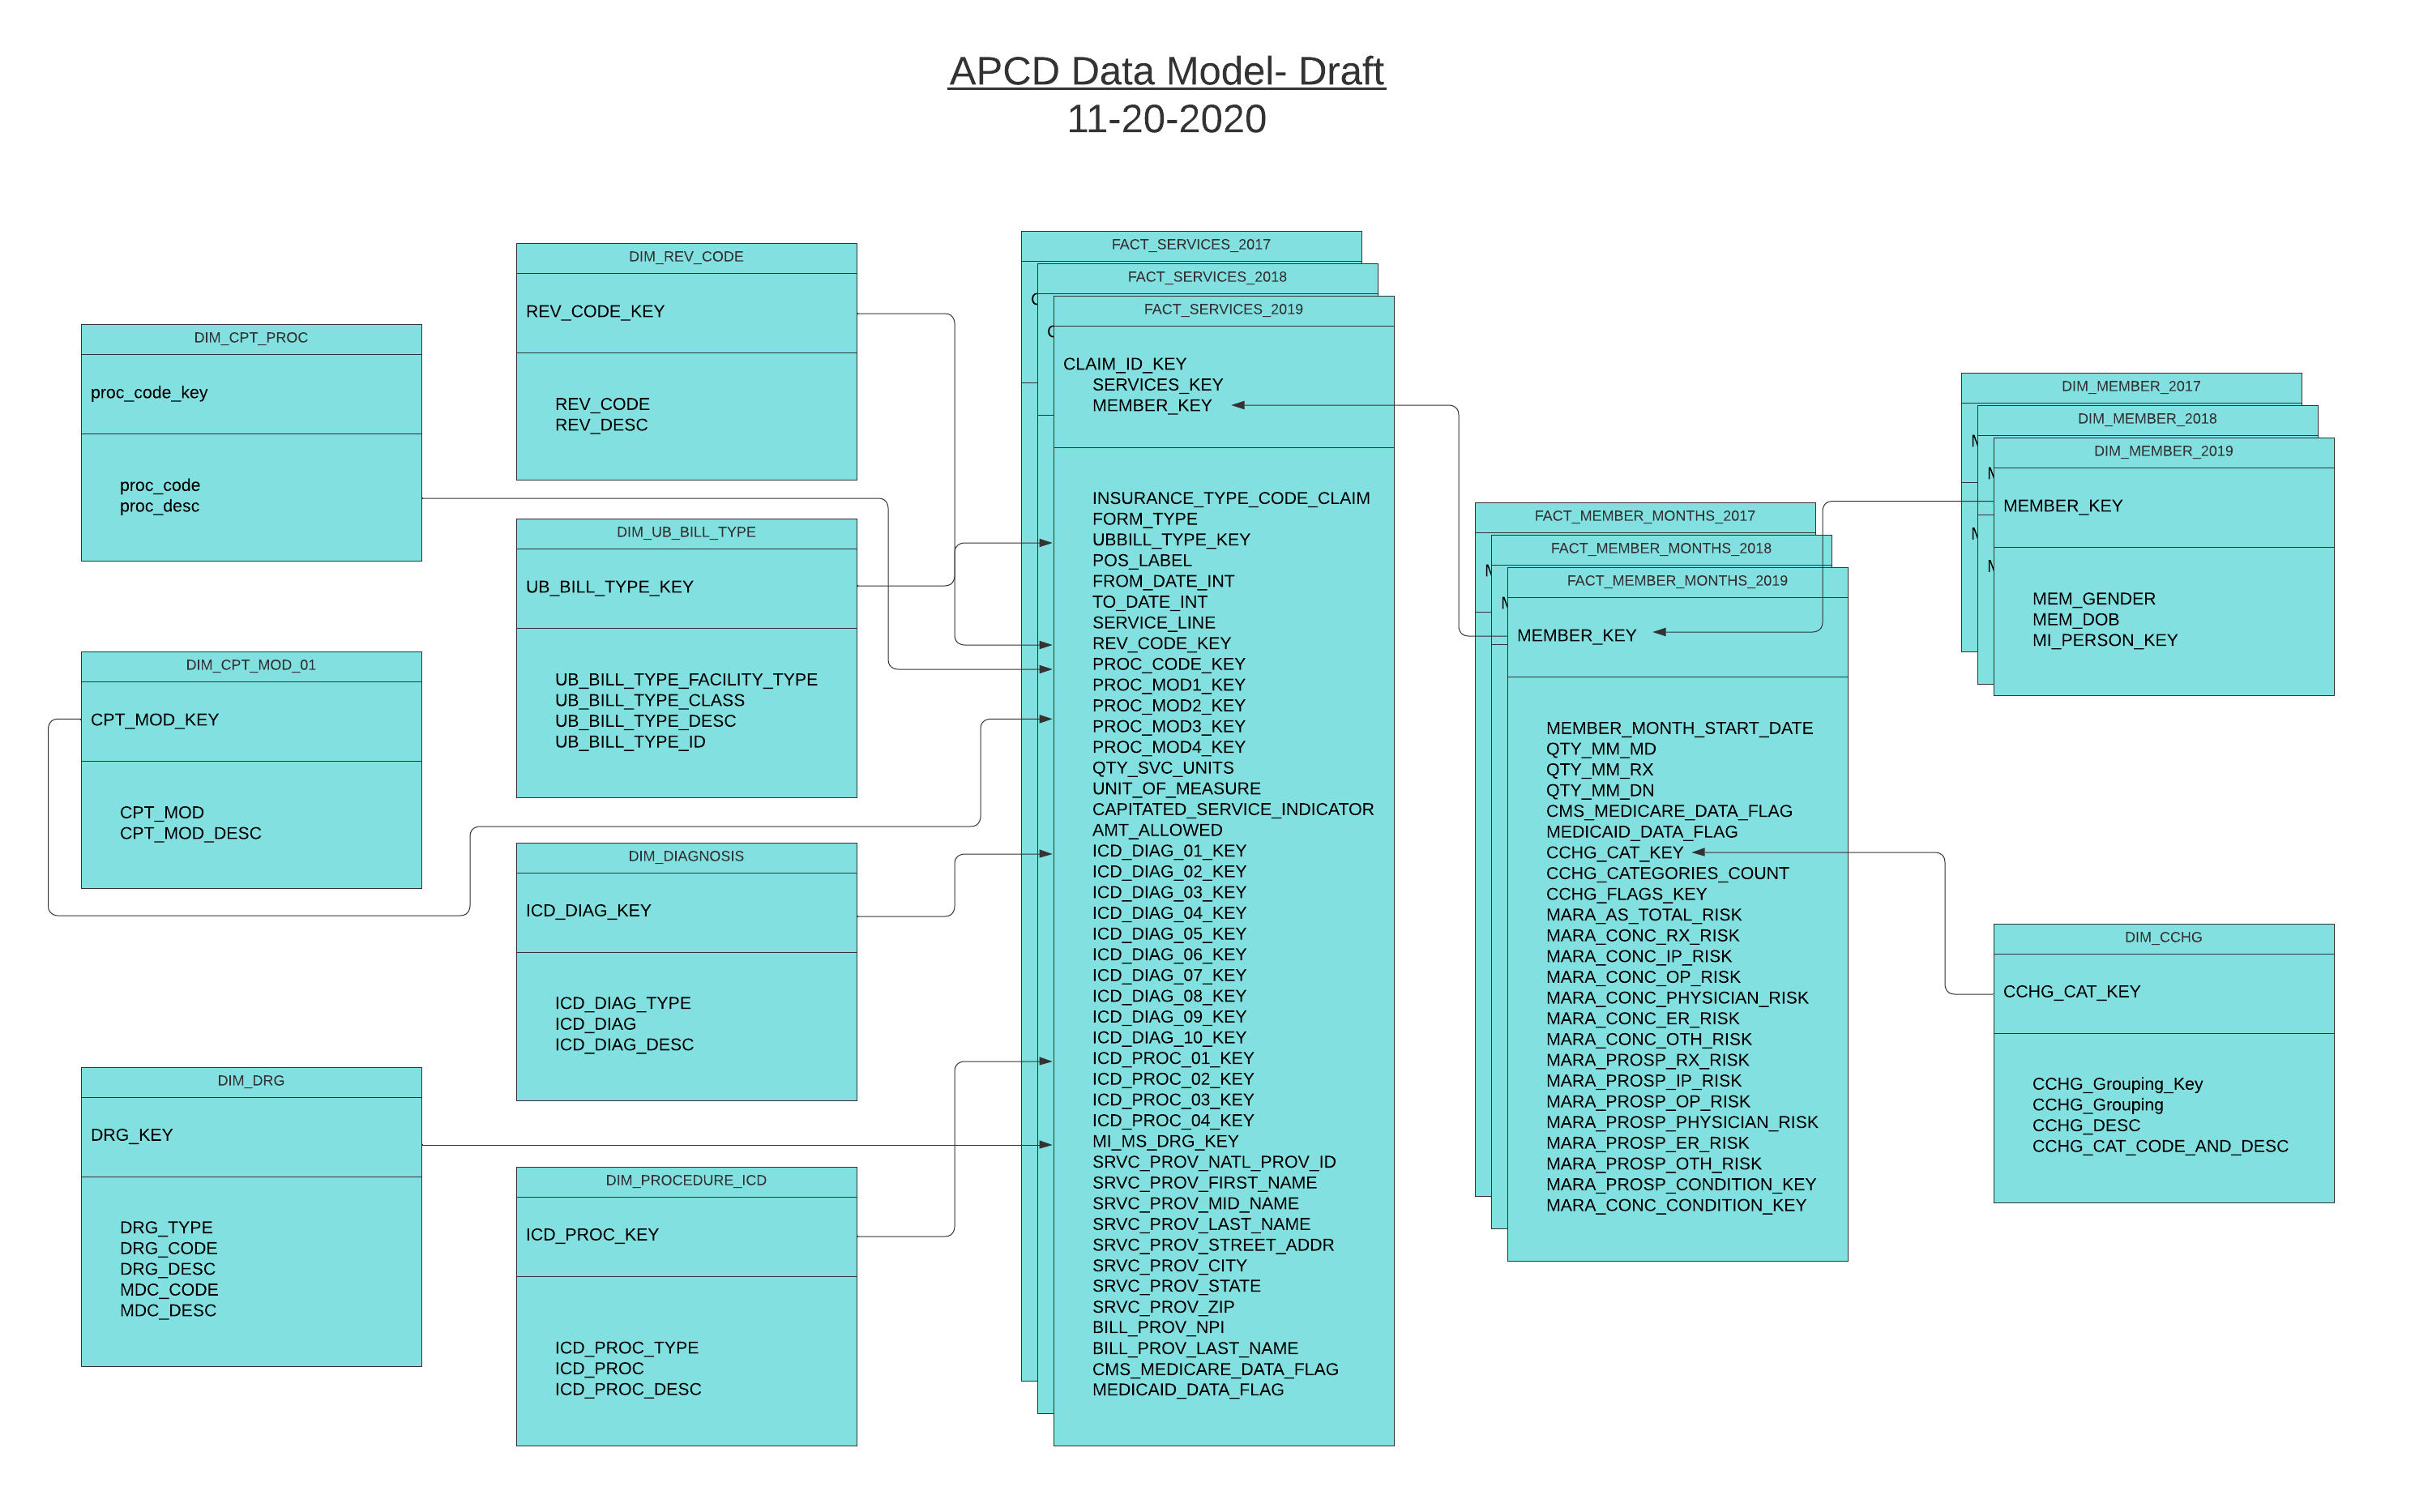
We then made a plan for how to ETL the data into the files required to load the graph in NEO4J.
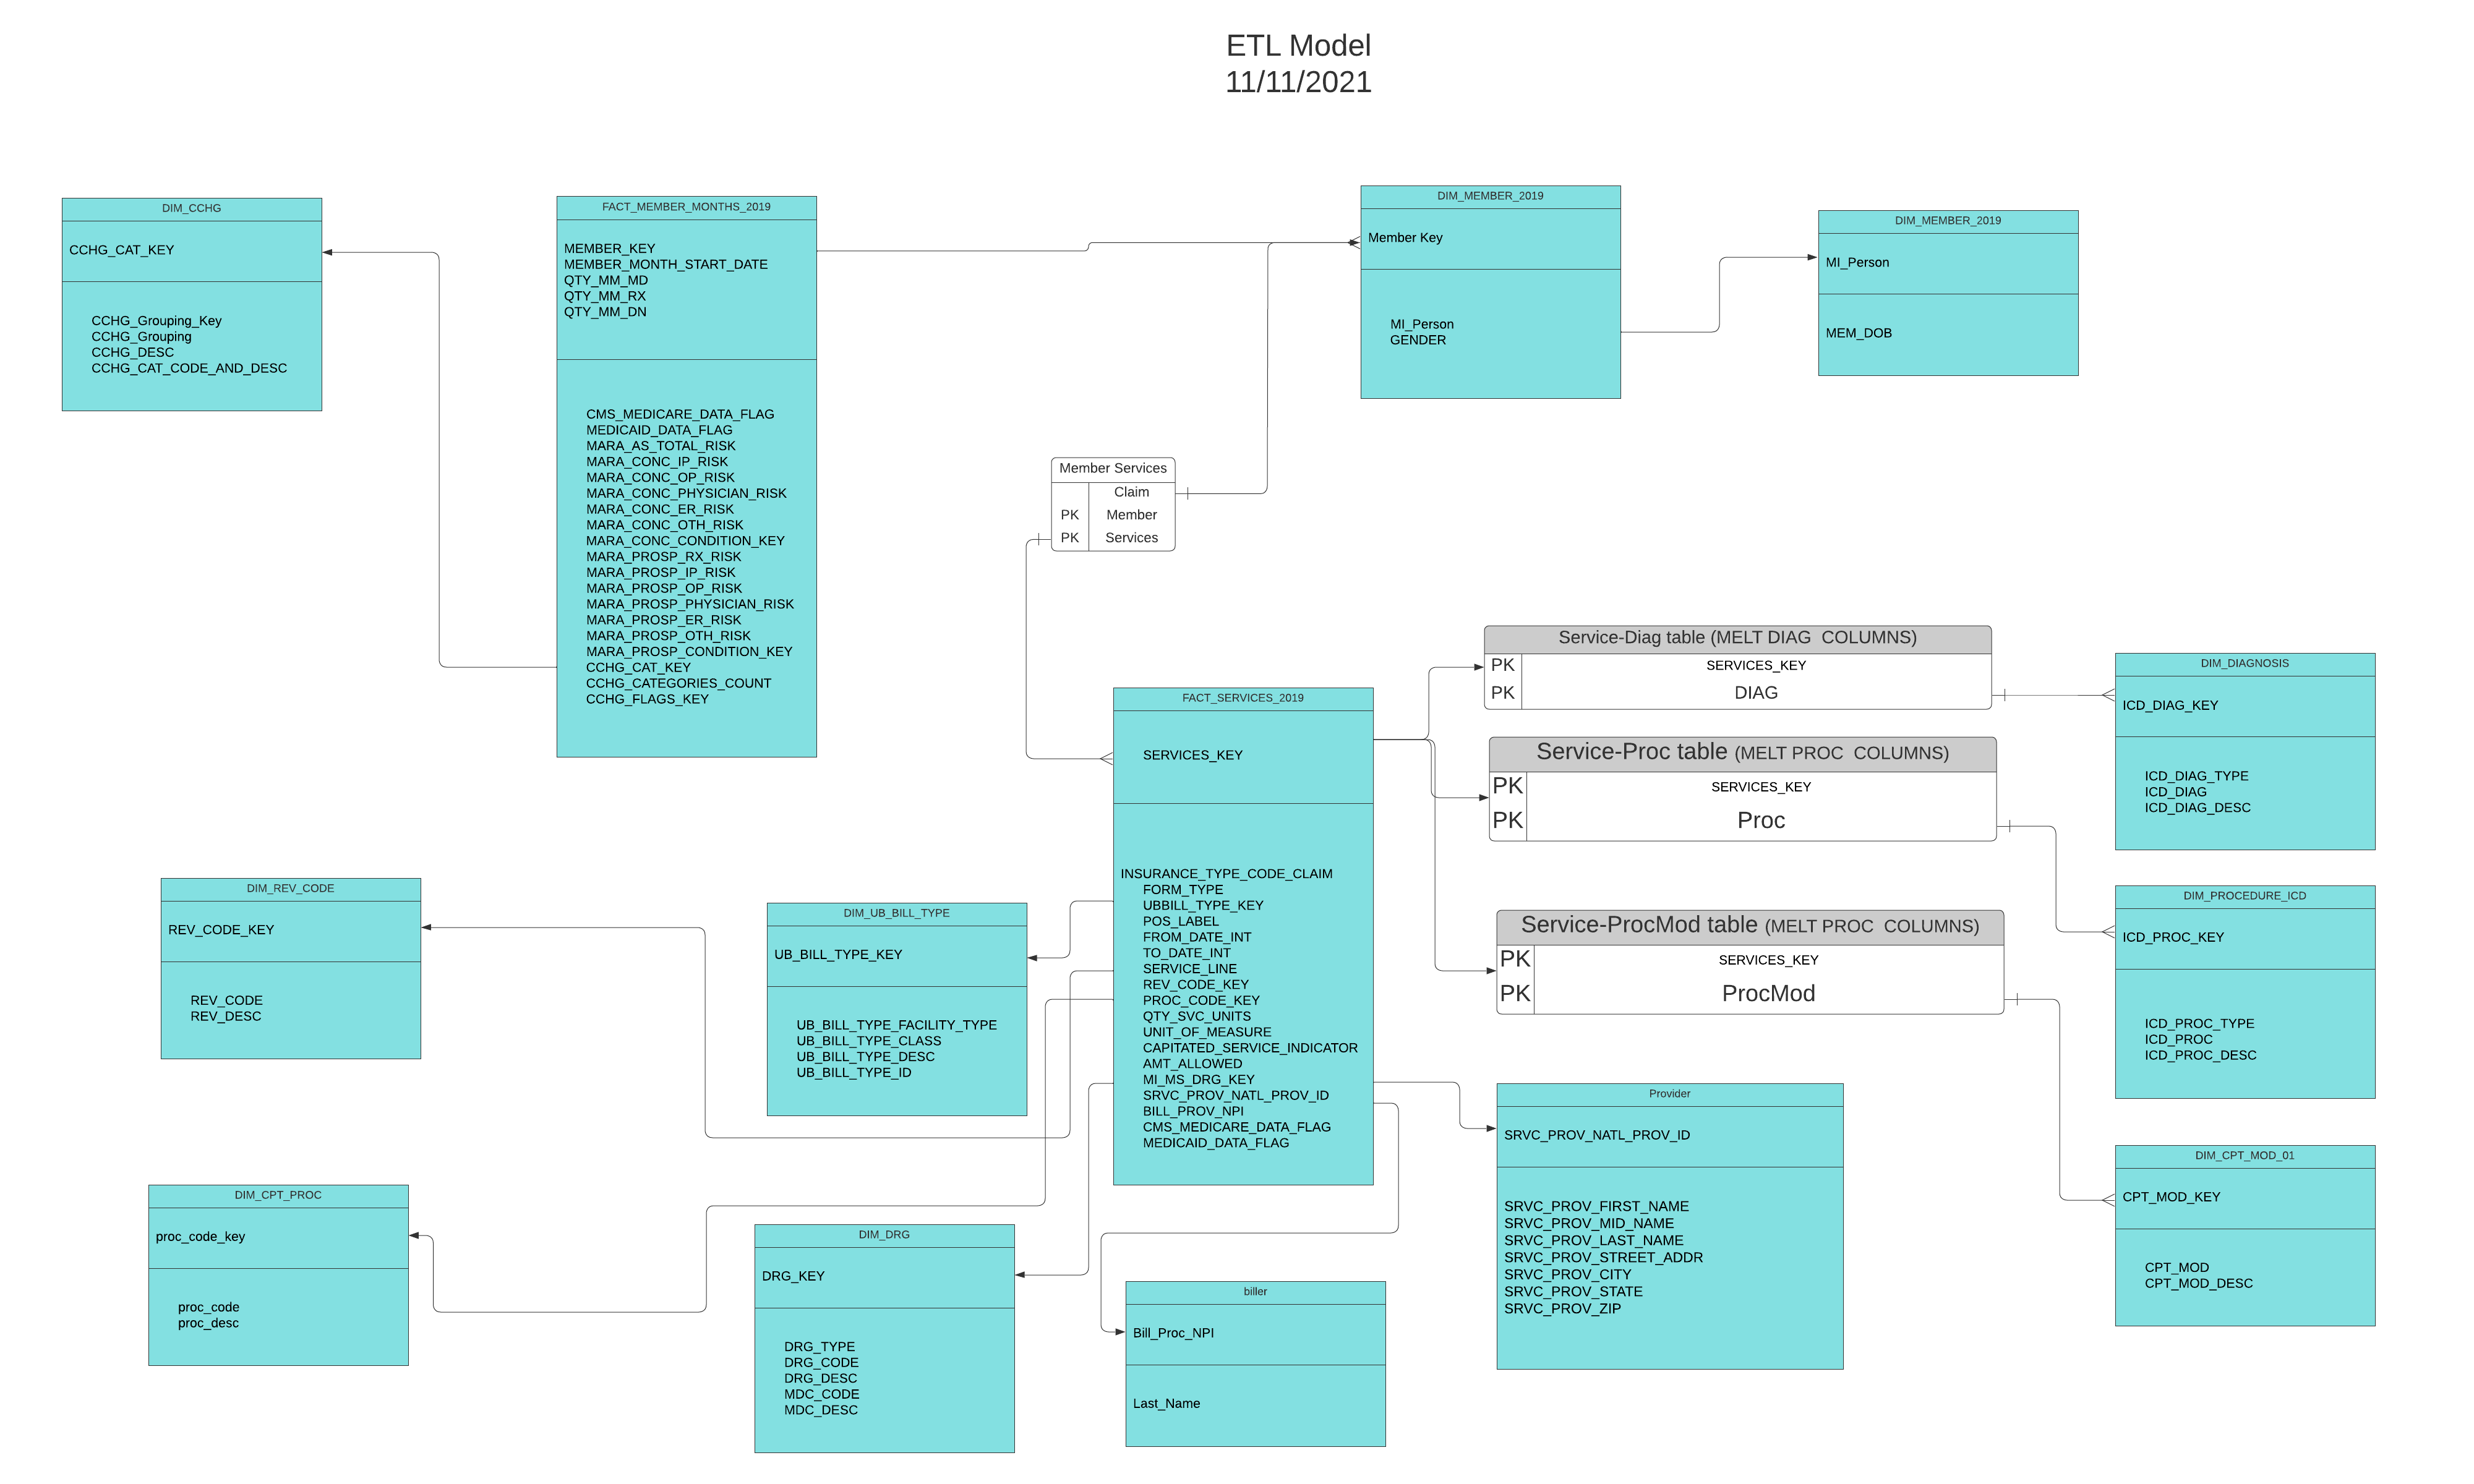 We used Talend Data Integration to extract data from the large raw data files we received, transform it and clean it and load it into a PostgreSQL database.
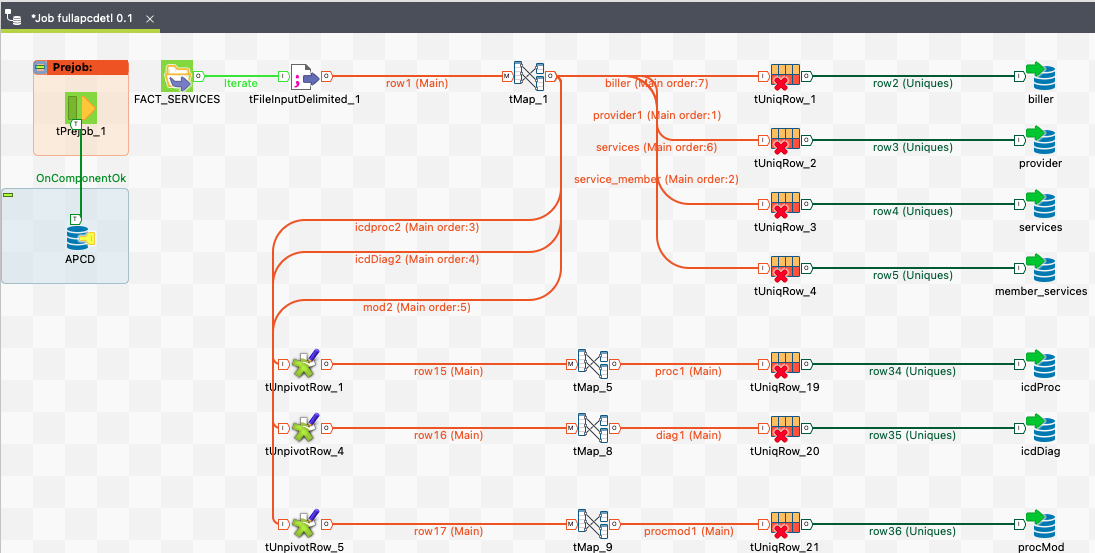
From there, we ran SQL quereies to produce the files to load according to the graph schema we designed for NEO4J
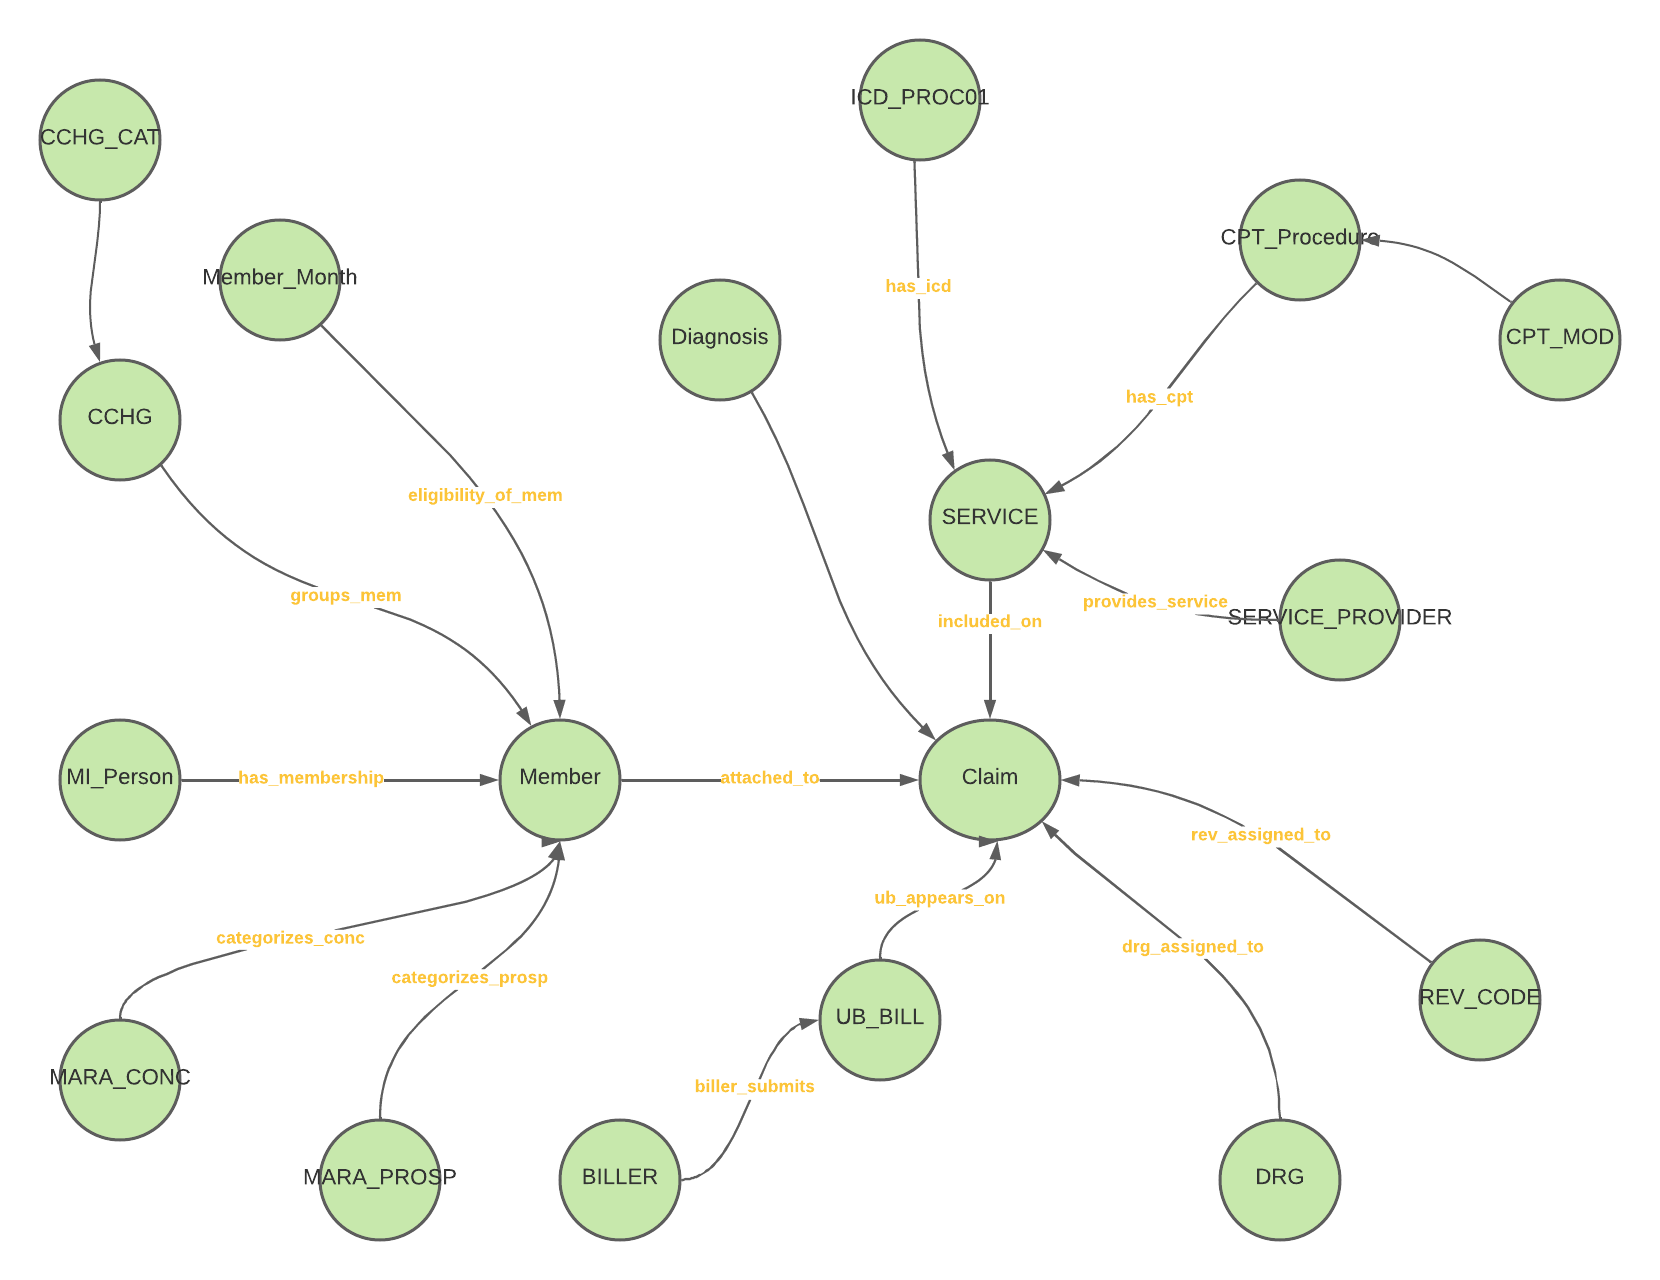 Here is the same schema in NEO4J after we loaded our initial test files.
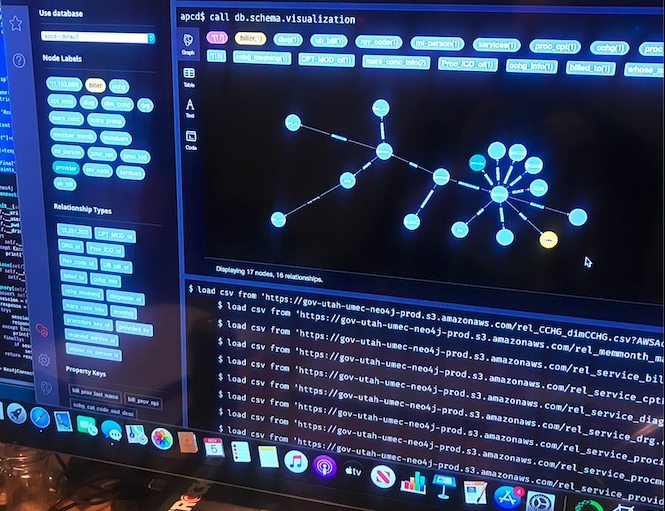
We are currently working on improving the data load process and cleaning up some identified bugs so that we can begin pursuing our exploration of machine learning algorithms to this data set.